


Time Series Analysis Using Apache Druid and Superset


And we're back with part 2 of our ongoing series focused on working with time-series data using Druid, Superset, and Prophet. In part 1, we set-up and configured Druid, connected it to Superset, and we are now ready to ingest some time-series data.
In this guide, we will:
- Ingest time-series data into Druid using the web GUI
- Create a visualization of that data in Superset
Step 1: Ingest time-series data into Druid
Navigate to Druid's web gui and click *Load Data on the top navigation bar.
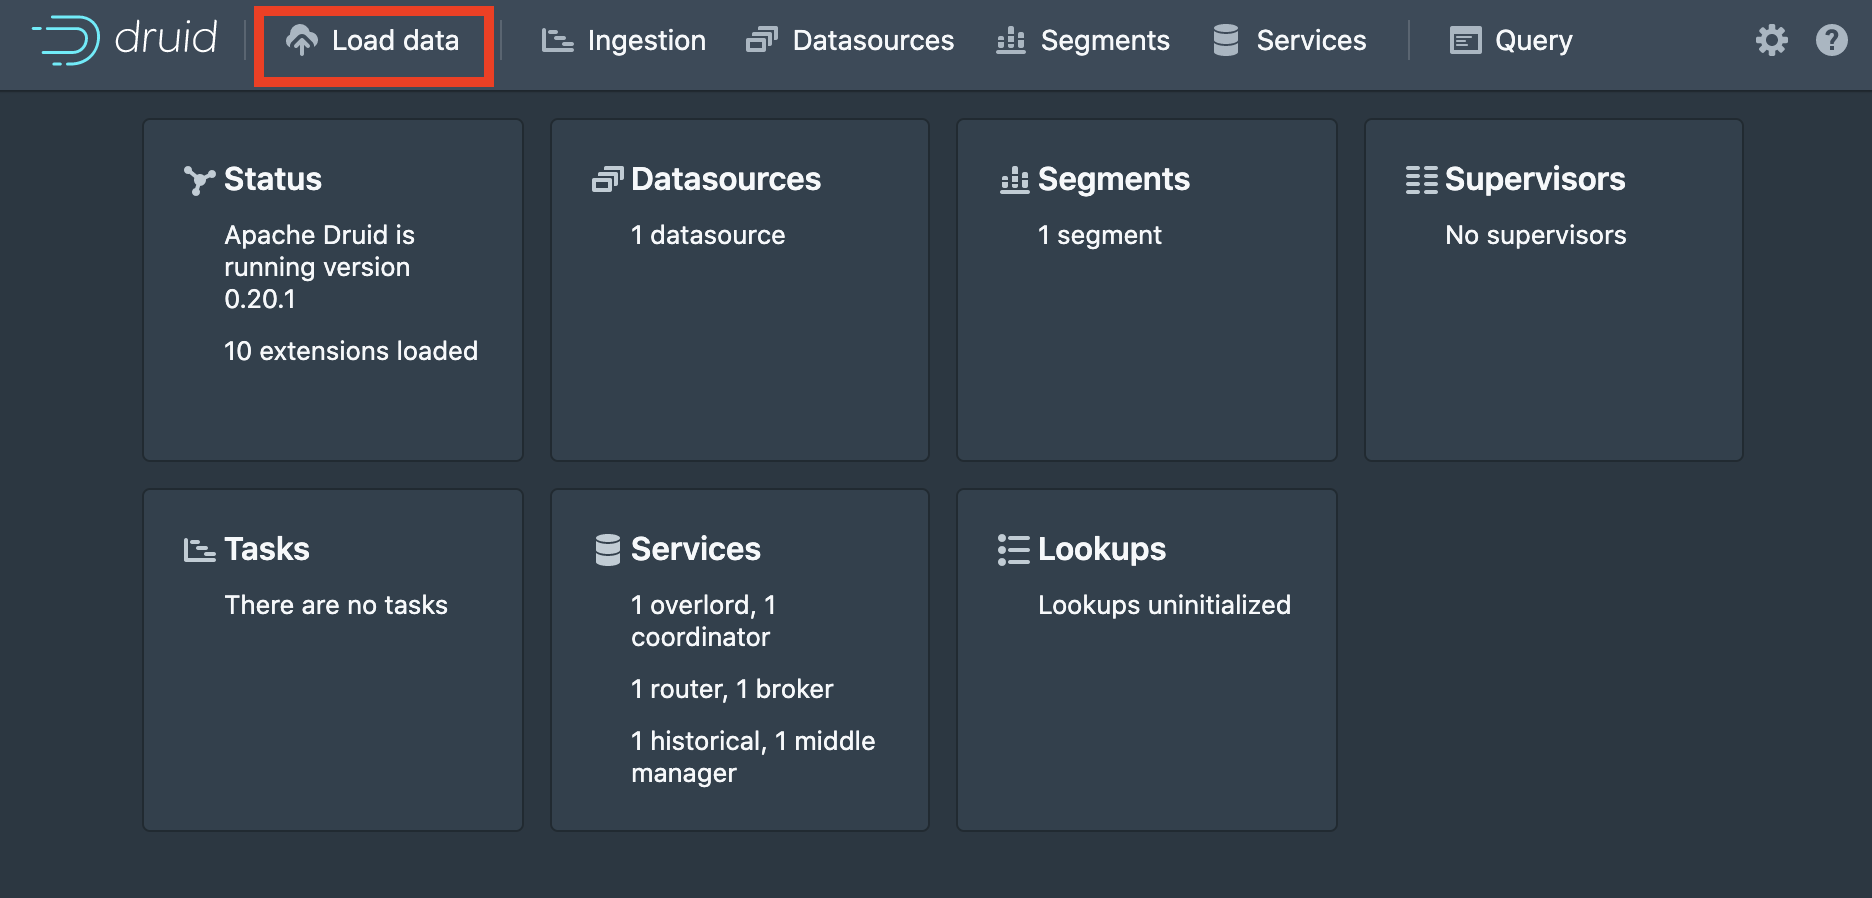
We are going to load the tutorial dataset included with Druid. This dataset consists of time-stamped wikipedia edit metadata created over the course of a single day. Select the local file datasource.

Here we input the base directory (relative to Druid's root directory) and a filename pattern for the file filter. The filter allows us to specify multiple files matching some naming pattern for ingestion at the same time. Druid's tutorial data is located in ./quickstart/tutorial/ with the filename wikiticker-2015-09-12-sampled.json.gz. Click apply to see the raw data displayed in the window.

When satisfied with the selected data, click Next: Parse data at the bottom to move on.
Druid has made some guesses as to the format of our data (in this case JSON). We can check that the data is being parsed as expected. For data that includes nested elements, a flatten spec can also be defined here to map the input data to Druid's flat data model. Click Next: Parse time to move on.

Druid's data model uses a special __time column derived from existing columns to segment the data. The Parse Time page gives control over how that __time column is created. Druid identifies columns containing time data and makes one the default selection.

We can also specify what to do with missing time values, or specify a constant time value for all the data. Click Next: Transform to continue.
Here on the Transform page, we can apply transformations to the columns, or derive new ones. Druid expressions are used to specify the transformations.

Click Next: Filter to continue.
Filters provide a way to to exclude unneeded columns or data meeting some criteria at ingestion time. Straightforward but useful.

Click Next: Configure schema to continue.
Here we have the option of tweaking the default schema that Druid has devised for the data. Click the top of each column to be presented with the option of renaming, recasting, and changing the units.

If we click the __time column instead, we are presented with another set of options that impact how the data is indexed and stored. We can disable explicit definition of column data types, which comes with a performance cost. Rollup groups neighboring rows into larger blocks to save storage space, useful when working with large amounts of infrequently accessed historical data. The granularity determines how the time-stamps are truncated. Be sure not to choose a granularity larger than what you expect to be querying the data on.

Choose Next: Partition to continue.
The next set of three pages all provide options relevant to partitioning and segmenting the data, tuning the ingestion job, and publishing the results. The Druid documentation covers this stuff in greater depth than we need for this tutorial, but all the info is there for the enterprising data engineer who is ready to go deeper. The only thing we need to do is give the resulting table a name on the Publish page.

At last, we are presented with the ingestion spec we just created for review in JSON format. Click Submit to start the job, which should take only a few minutes with the tutorial data.

Modern data technologies are complex, and how easy that complexity is to learn impacts adoption. I am really fond of how Druid uses its GUI to make learning its data ingestion process easy. Not sure if "GUI as documentation" is a paradigm yet, but Druid makes a good case for it.
Part 2: Creating a time-series visualization in Superset
If you have been following along since part1 then you already have a running instance of Superset (or Preset cloud) connected to your Druid cluster.
First, we must add the table we ingested into Druid to Superset. Mouse over Data on the top bar then select Datasets from the drop-down.

Here we select the Druid datasource we created in part 1, the schema ('druid' by default), and the table name chosen when the ingestion job was created.

Select Add and observe the notification pop-up confirming the dataset was added.
From Superset's home screen (or anywhere else), mouse-over the + on the top bar and select chart.

Select the dataset we just added, then click the Table bubble to choose the visualization type.

Superset currently offers five different time-series visualization types, and each will get some detailed. Choose time-series chart.

To see the data, we need to remove the default time filter and change the granularity to something smaller than day (try hour and minute).

We are finally presented with the fruit of our labor in the form of a nice wiggly line showing the edit frequency over the time-period in the tutorial data.

To save the chart, we should give it a name and click the + save button.

Join our community slack, visit Superset on Github, and get involved!
