


Delivering Dashboards as Code: An Illustrative Case Study Using dbt and Preset


Preset offers a rich UI from which you can manage your databases, datasets, charts, dashboards, and more, allowing technical and non-technical users to build assets and find the answers they need. There are times when you need more control over these assets — you want to manage them as code so you can benefit from version control systems, code review, continuous deployments, and more.
In a series of recent posts, our engineer Beto Dealmeida showcased the workflow of managing Superset database connections, datasets, charts, and dashboards as code:
- Managing Apache Superset Assets as Code with Preset
- Creating Custom Assets in Apache Superset Programmatically Using Preset
- dbt and Preset
In this post I’ll be sharing an illustrative use case in using your Preset dashboards built off of dbt resources and how to manage these assets in source control as part of the software development lifecycle in the hope that it can be a helpful reference for users of both Apache Superset and Preset Cloud!
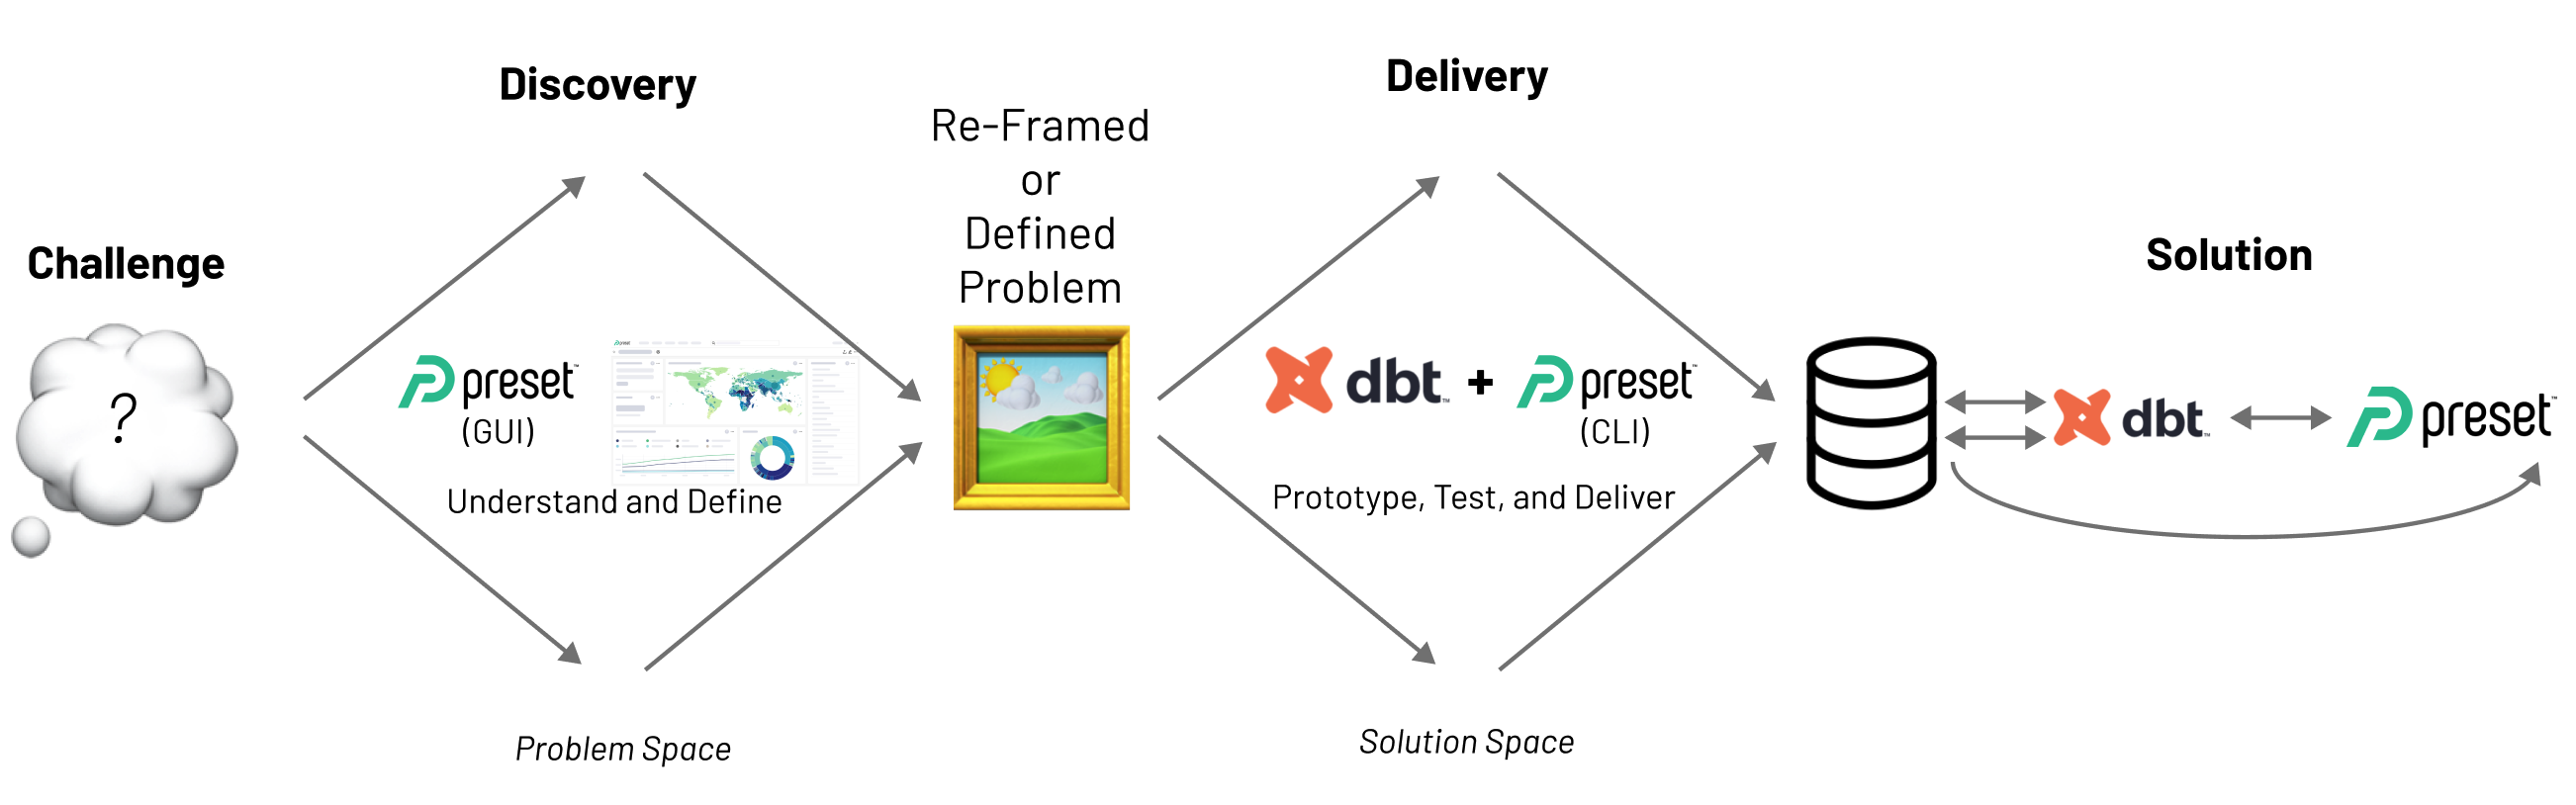
Dashboard Discovery vs Delivery
A popular bike-sharing system company is interested in creating dashboards for internal analysts with the goal of better understanding their customers:
- What are the most popular stations?
- Does this differ between subscribers and non-subscribers?
- What time or days are customers most active?
- How far does the average customer travel?
- How long does the average customer keep a bike checked out?
The company ultimately wants the delivery of a dashboard that will contain the visualizations to answer the questions above to support the end goal of selling more subscriptions and optimizing their services for their heaviest users and locations.
Before the company can build, ship, and maintain a production quality data product (delivery) for their analyst team to rely on, they have to make decisions about what to build (discovery).
Luckily for the analysts, all of the raw data they need regarding their system’s ride history is available to them! The company easily and quickly connects their database to Preset and the analysts begin their discovery process.
Discovery with Preset
The company has connected the database that houses the raw trip history data to their Preset workspace and built the dashboard below:
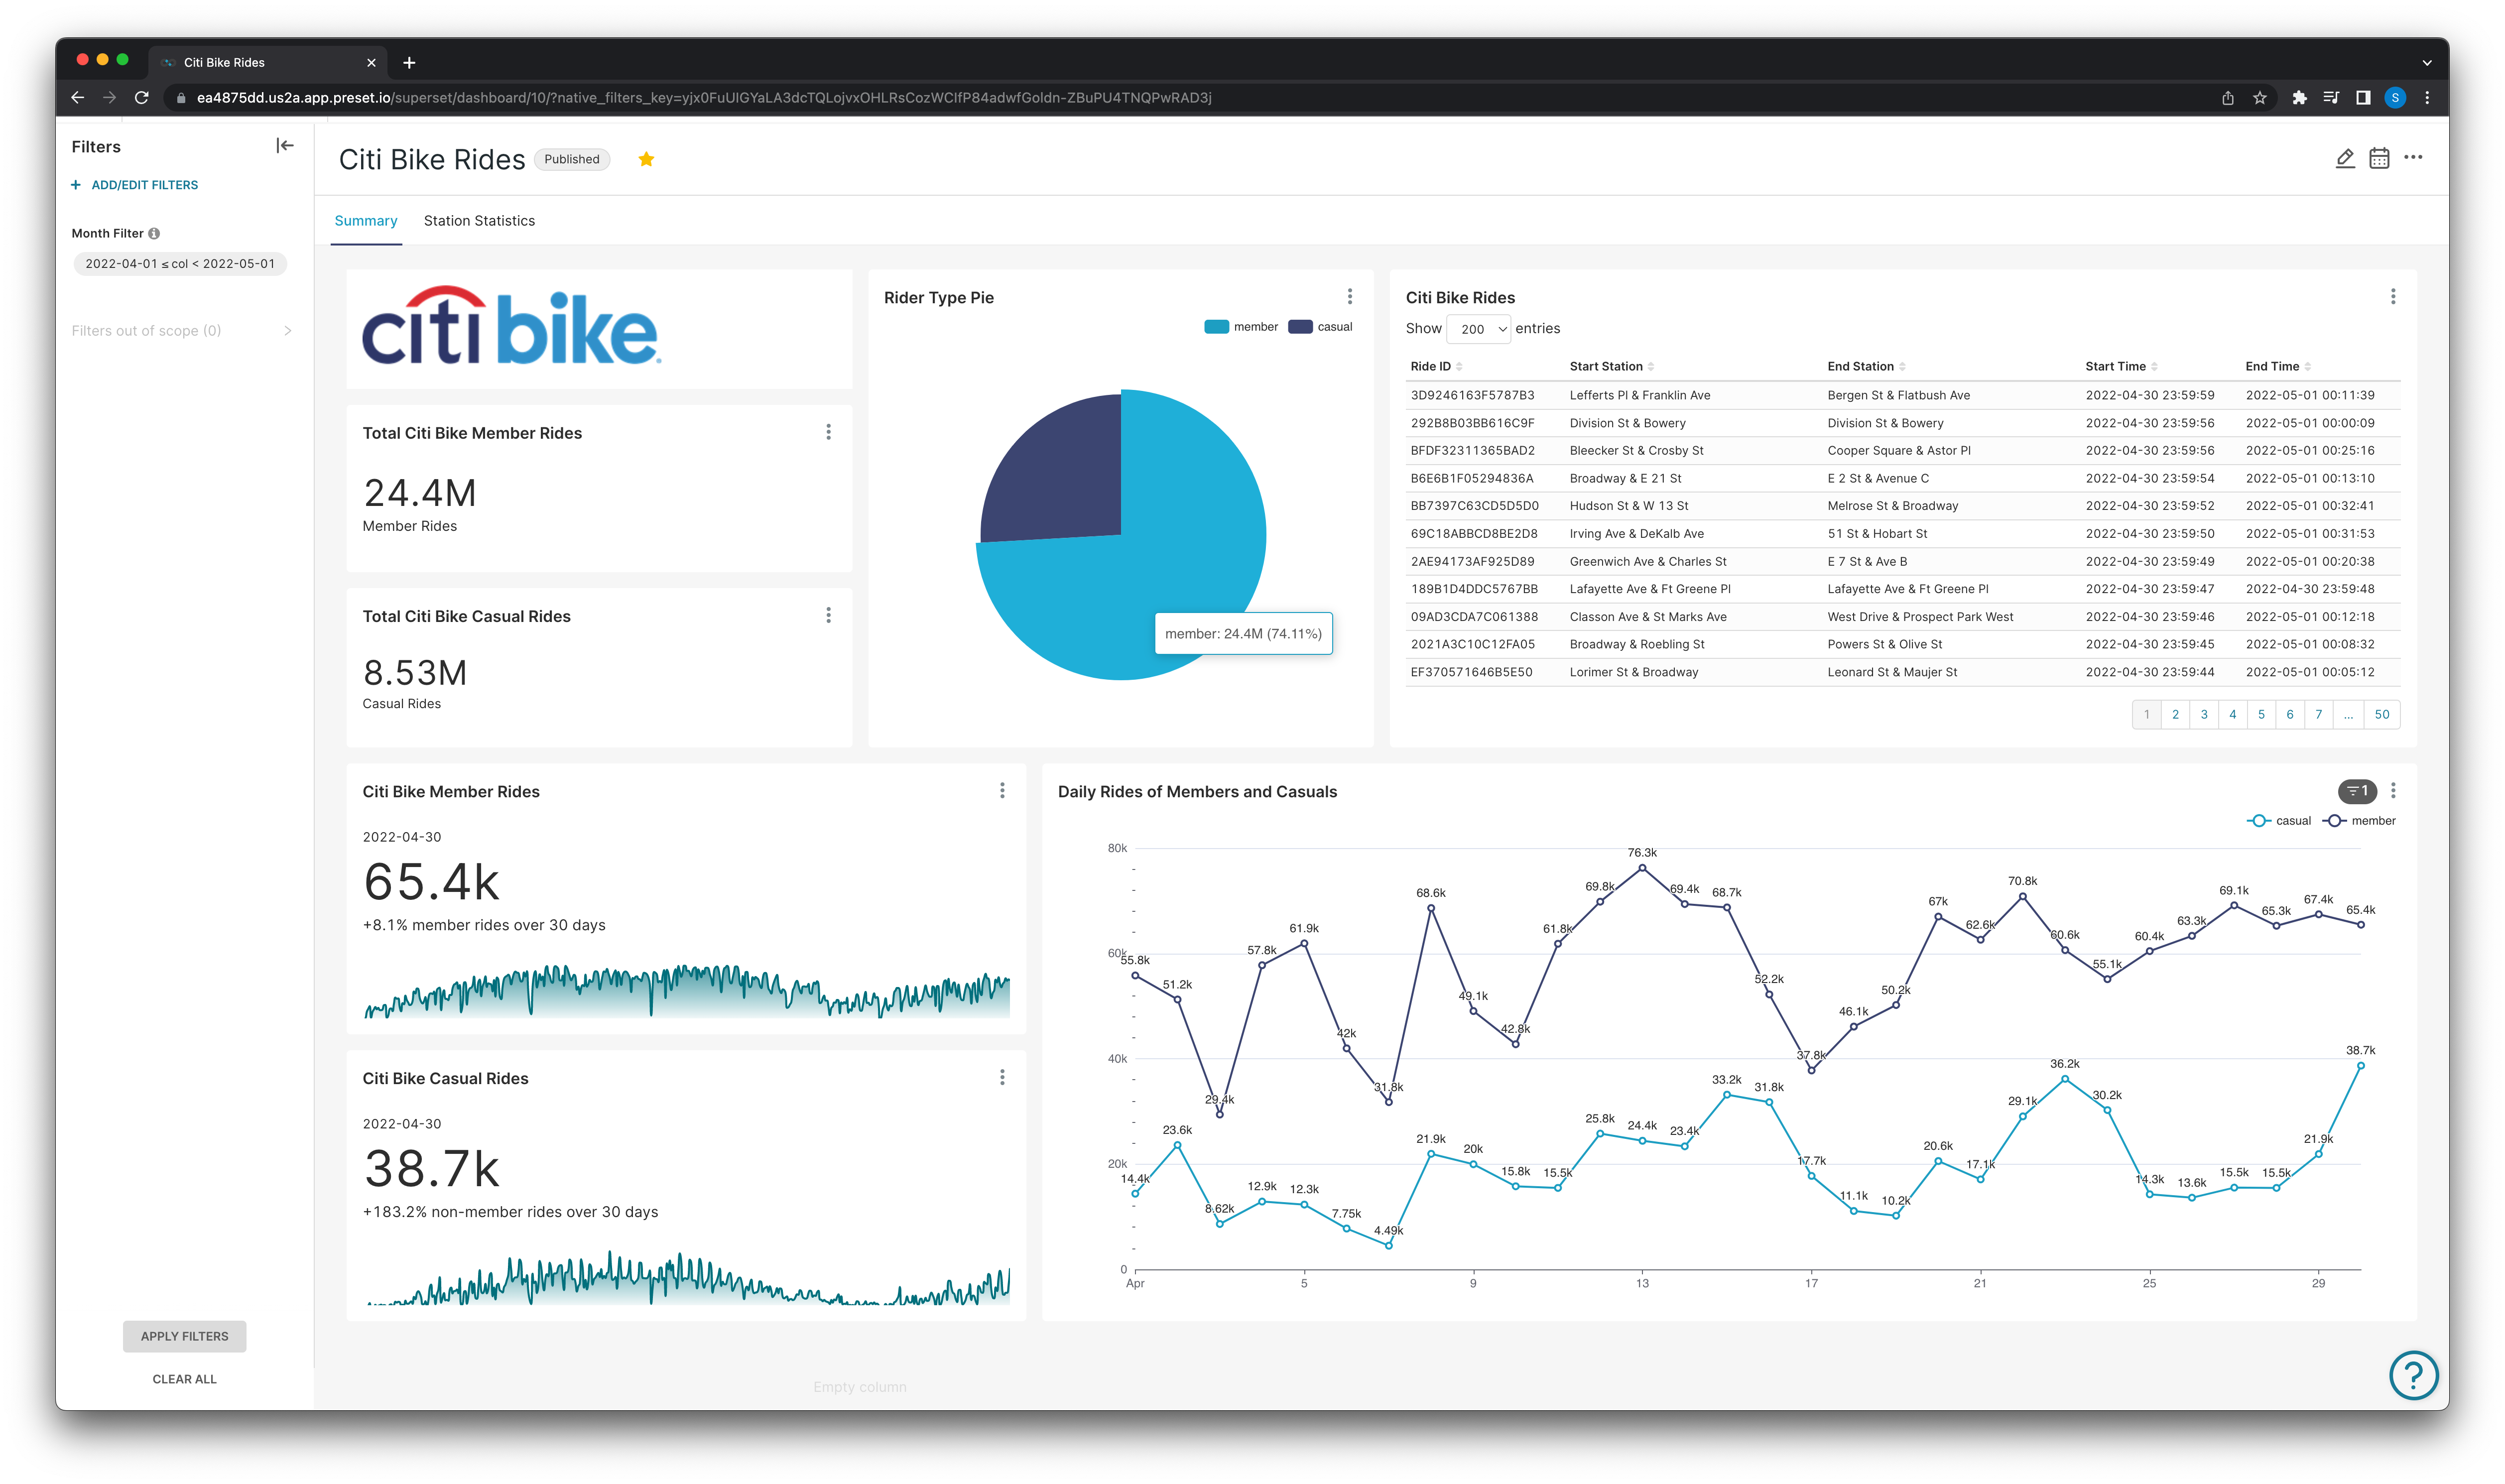
General ride statistics for members and non-members.
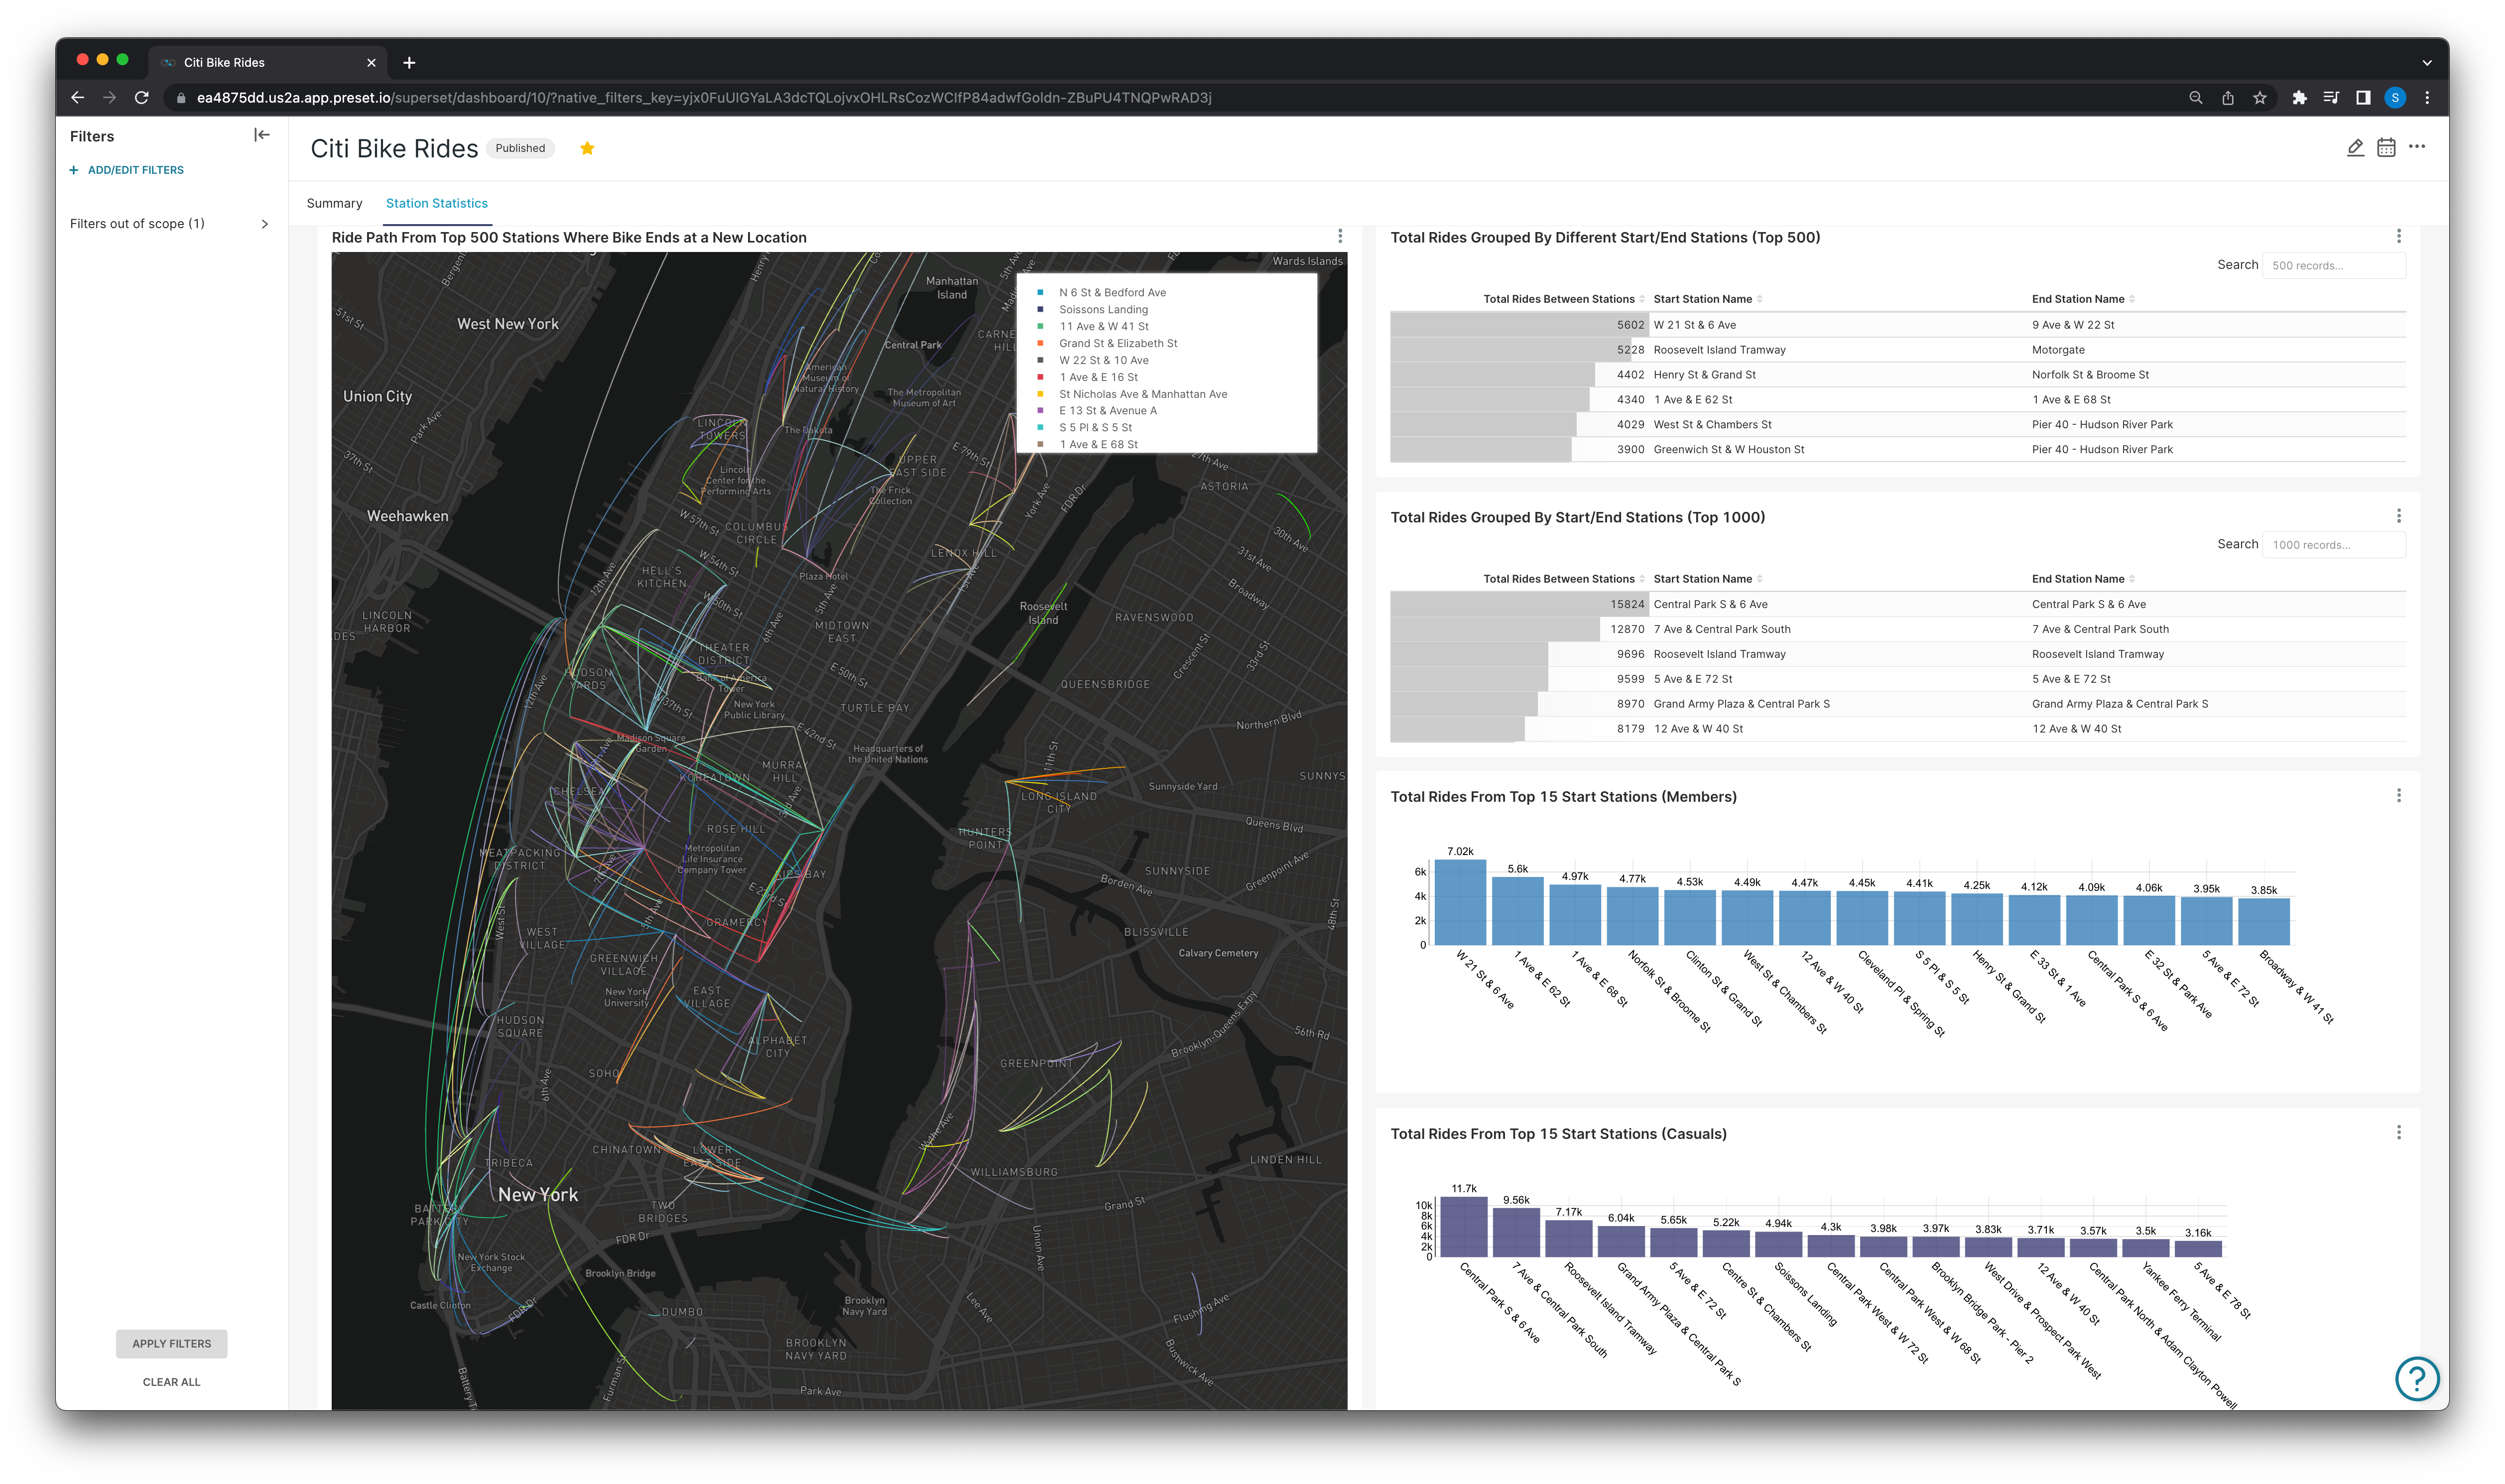
Station specific statistics.
At the end of the discovery phase, the company feels confident in their final dashboard and begins the delivery process.
The dashboard in this example was built using Citi Bike’s (the primary bike share system in NYC) trip history data and real-time system data in General Bikeshare Feed Specification.
In a previous post I went further in-depth into what the datasets are and what we can derive from them — check out A Case Study in Dataset-Centric Visualization Using dbt and Snowflake for more on that!
Delivery with dbt and Preset Cloud
In this and the following sections all the dbt specific sample code, files, and datasets are available in my Preset-dbt-Demo repo: https://github.com/shreesham/preset-dbt-demo
As mentioned in the previous section, discovery is the process of making decisions to decide what to build, and delivery is the work that encompasses the building, shipping, and maintenance.
Why dbt?
dbt is a transformation workflow that lets teams quickly and collaboratively deploy analytics code following software engineering best practices like modularity, portability, CI/CD, and documentation. dbt helps in creating a solid and organizationally trusted data infrastructure that can now be used as the basis for building and managing “certified” or trusted datasets to allow end-users to perform analysis or visualizations on, as well as making accurate data driven decisions.
Preset Cloud’s Integration with dbt
With Preset Cloud’s dbt integration users can now define databases, datasets, and metrics as version controlled assets using dbt and sync them to Preset Cloud.
Installing the Preset open source CLI is a prerequisite to be able to interact with your Preset workspaces and synchronize your dbt models into that workspace. Steps to install the CLI can be found in the previously linked CLI repo.
dbt Project Breakdown
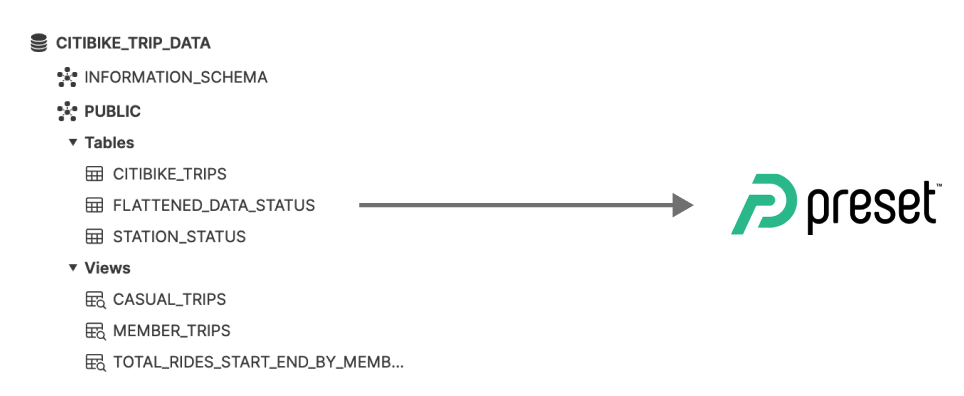
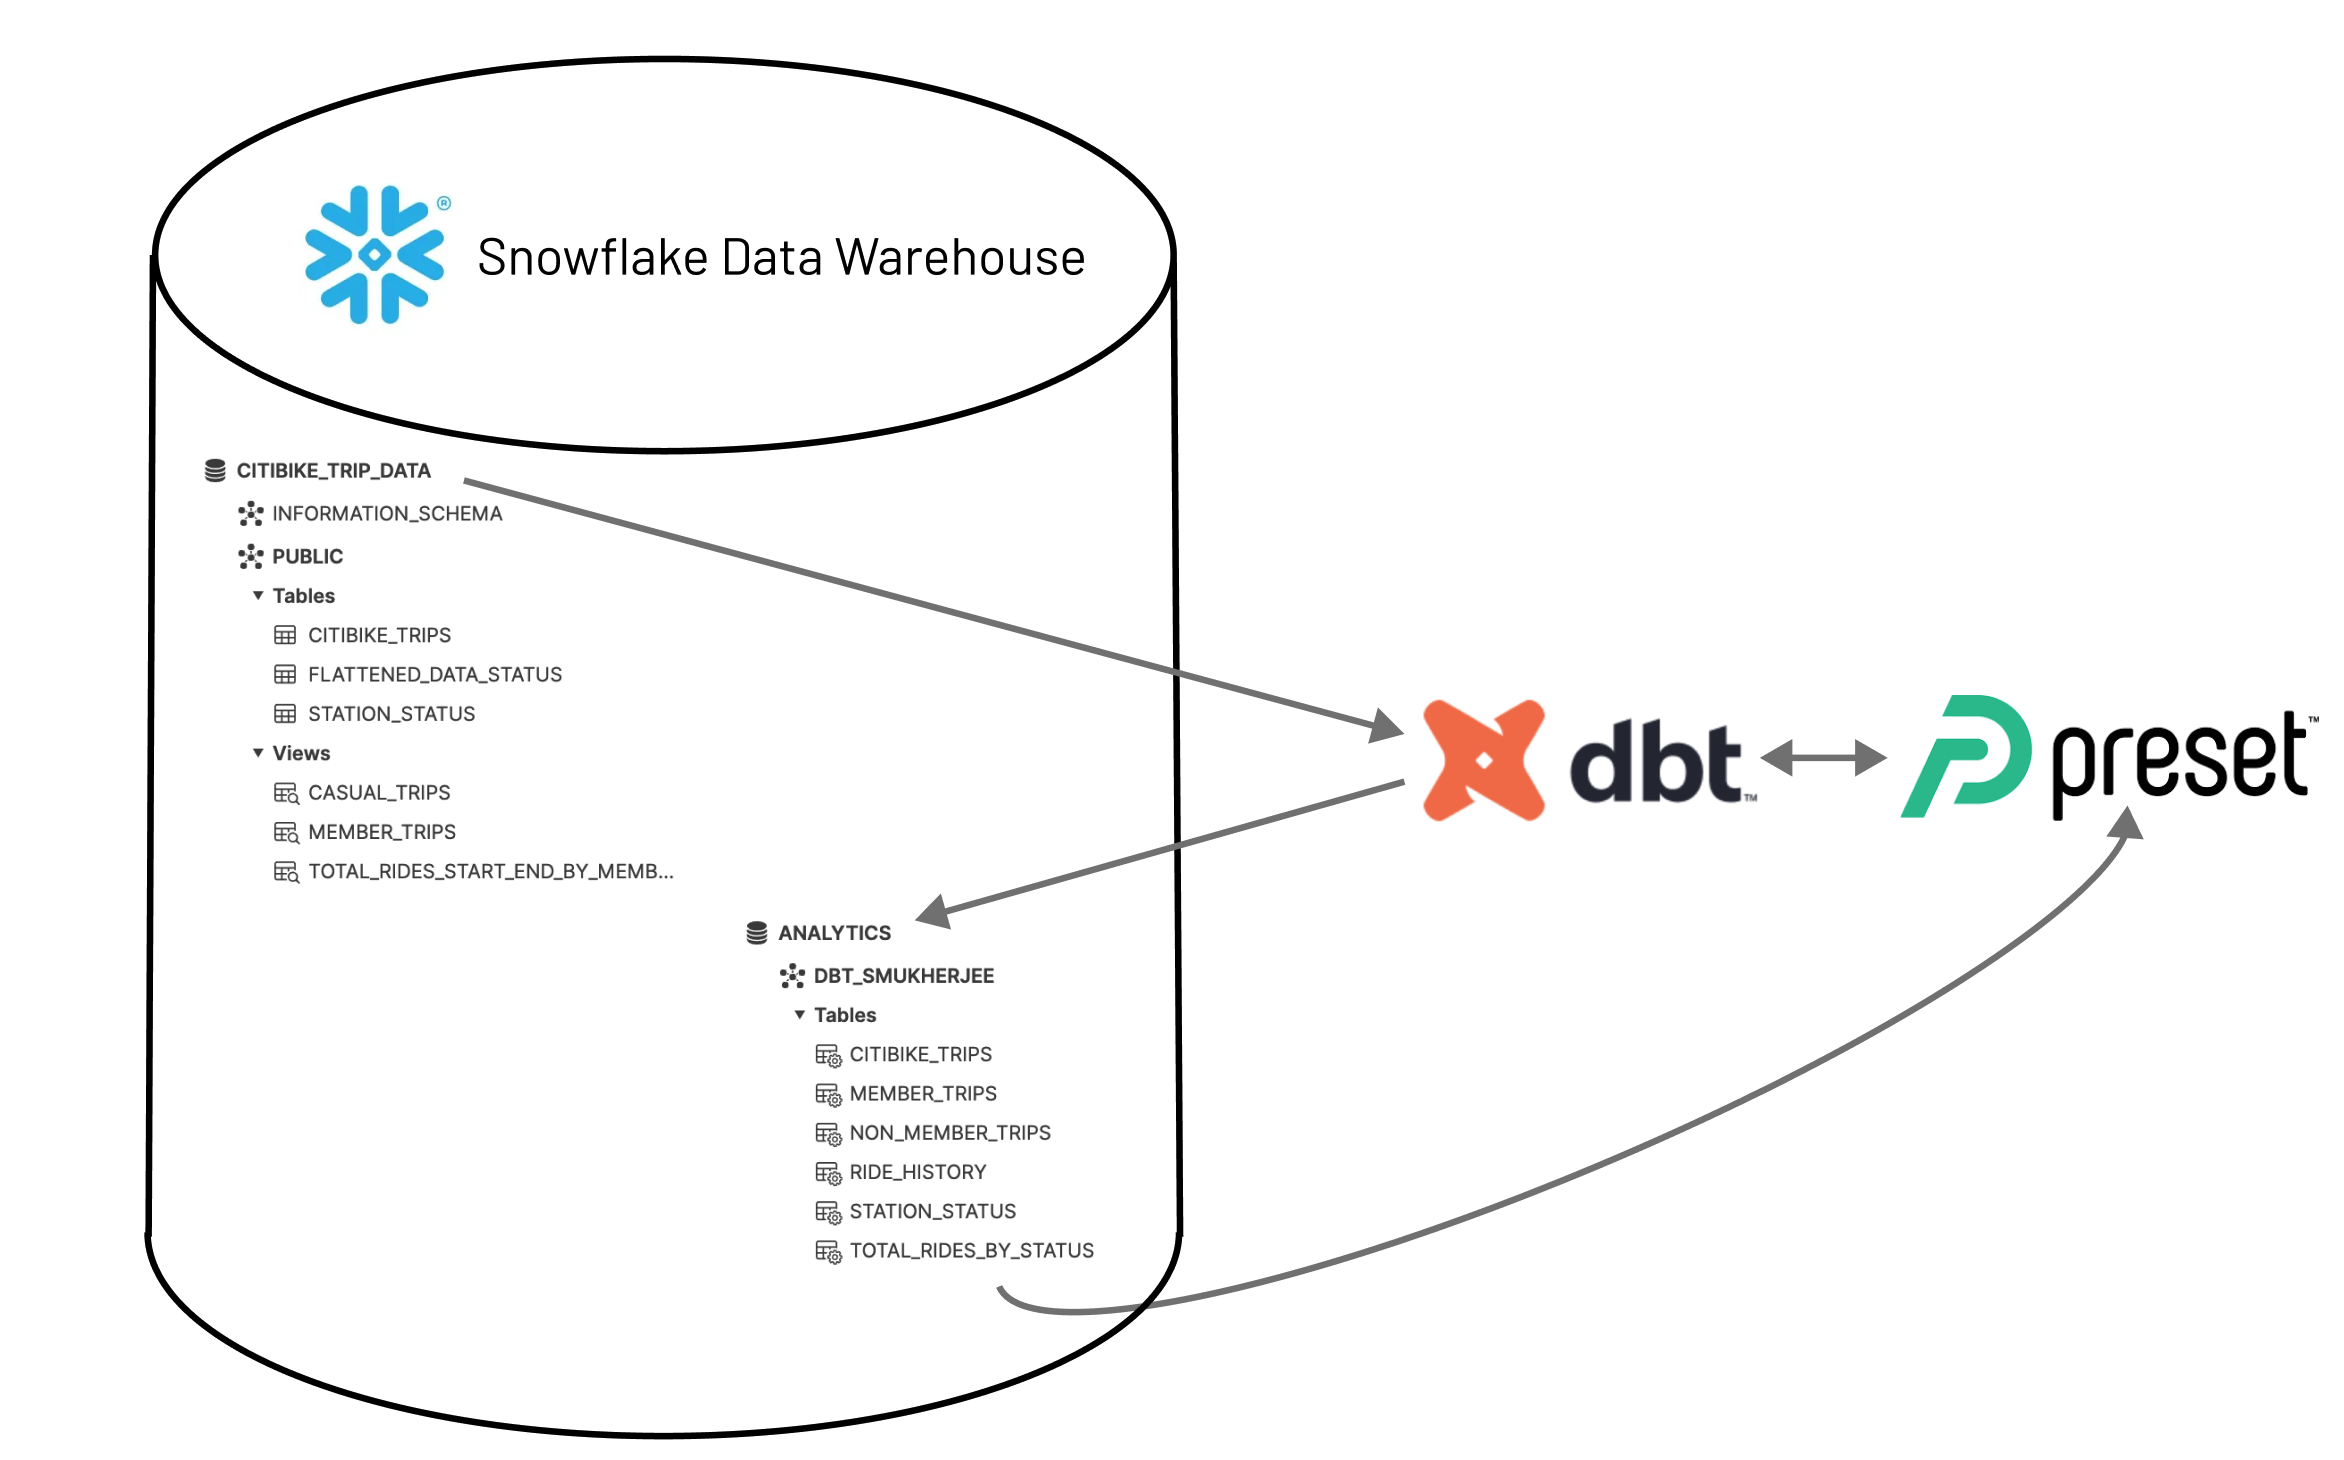
Before diving in — It’s important to understand how dbt connects to your database and transforms your data. dbt transforms your data where it lives (as seen above).
Once dbt is connected to your data’s location, dbt will create a new database where the resulting datasets derived from your models will be materialized.
- In our diagram above, the
CITIBIKE_TRIP_DATAis the raw data database in the warehouse. - dbt connects to that database and creates a new
ANALYTICSdatabase with the transformed datasets to be used for dashboard.
When working with a dbt project, users will have a profiles.yml file in their local ~/.dbt directory which dbt looks in for connection details:
bike_dbt_demo:
  outputs:
    analytics:
      account: xyz123.us-east-2.aws
      database: analytics
      password: hunter2
      role: accountadmin
      schema: dbt_smukherjee
      threads: 4
      type: snowflake
      user: AzureDiamond
      warehouse: compute_wh
  target: analytics
The project name (or names) in this profile will be the same name defined for your project configurations in the dbt_project.yml file:
# Name your project! Project names should contain only lowercase characters
# and underscores. A good package name should reflect your organization's
# name or the intended use of these models
name: 'bike_dbt_demo'
version: '1.0.0'
config-version: 2

# This setting configures which "profile" dbt uses for this project.
profile: 'bike_dbt_demo'

# These configurations specify where dbt should look for different types of files.
# The `model-paths` config, for example, states that models in this project can be
# found in the "models/" directory. You probably won't need to change these!
model-paths: ["models"]
analysis-paths: ["analyses"]
test-paths: ["tests"]
seed-paths: ["seeds"]
macro-paths: ["macros"]
snapshot-paths: ["snapshots"]

target-path: "target"  # directory which will store compiled SQL files
clean-targets:         # directories to be removed by `dbt clean`
  - "target"
  - "dbt_packages"

# Configuring models
# Full documentation: https://docs.getdbt.com/docs/configuring-models

# In this example config, we tell dbt to build all models in the example/ directory
# as tables or views. These settings can be overridden in the individual model files
# using the `{{ config(...) }}` macro.
models:
  bike_dbt_demo:
    # Config indicated by + and applies to all files under models/example/
    historical:
      +materialized: table
    gbfs:
      +materialized: view
		derived:
			+materialized: table
dbt Models Breakdown
In this dbt project we created three specific model directories, each named for the purpose of the models being created:
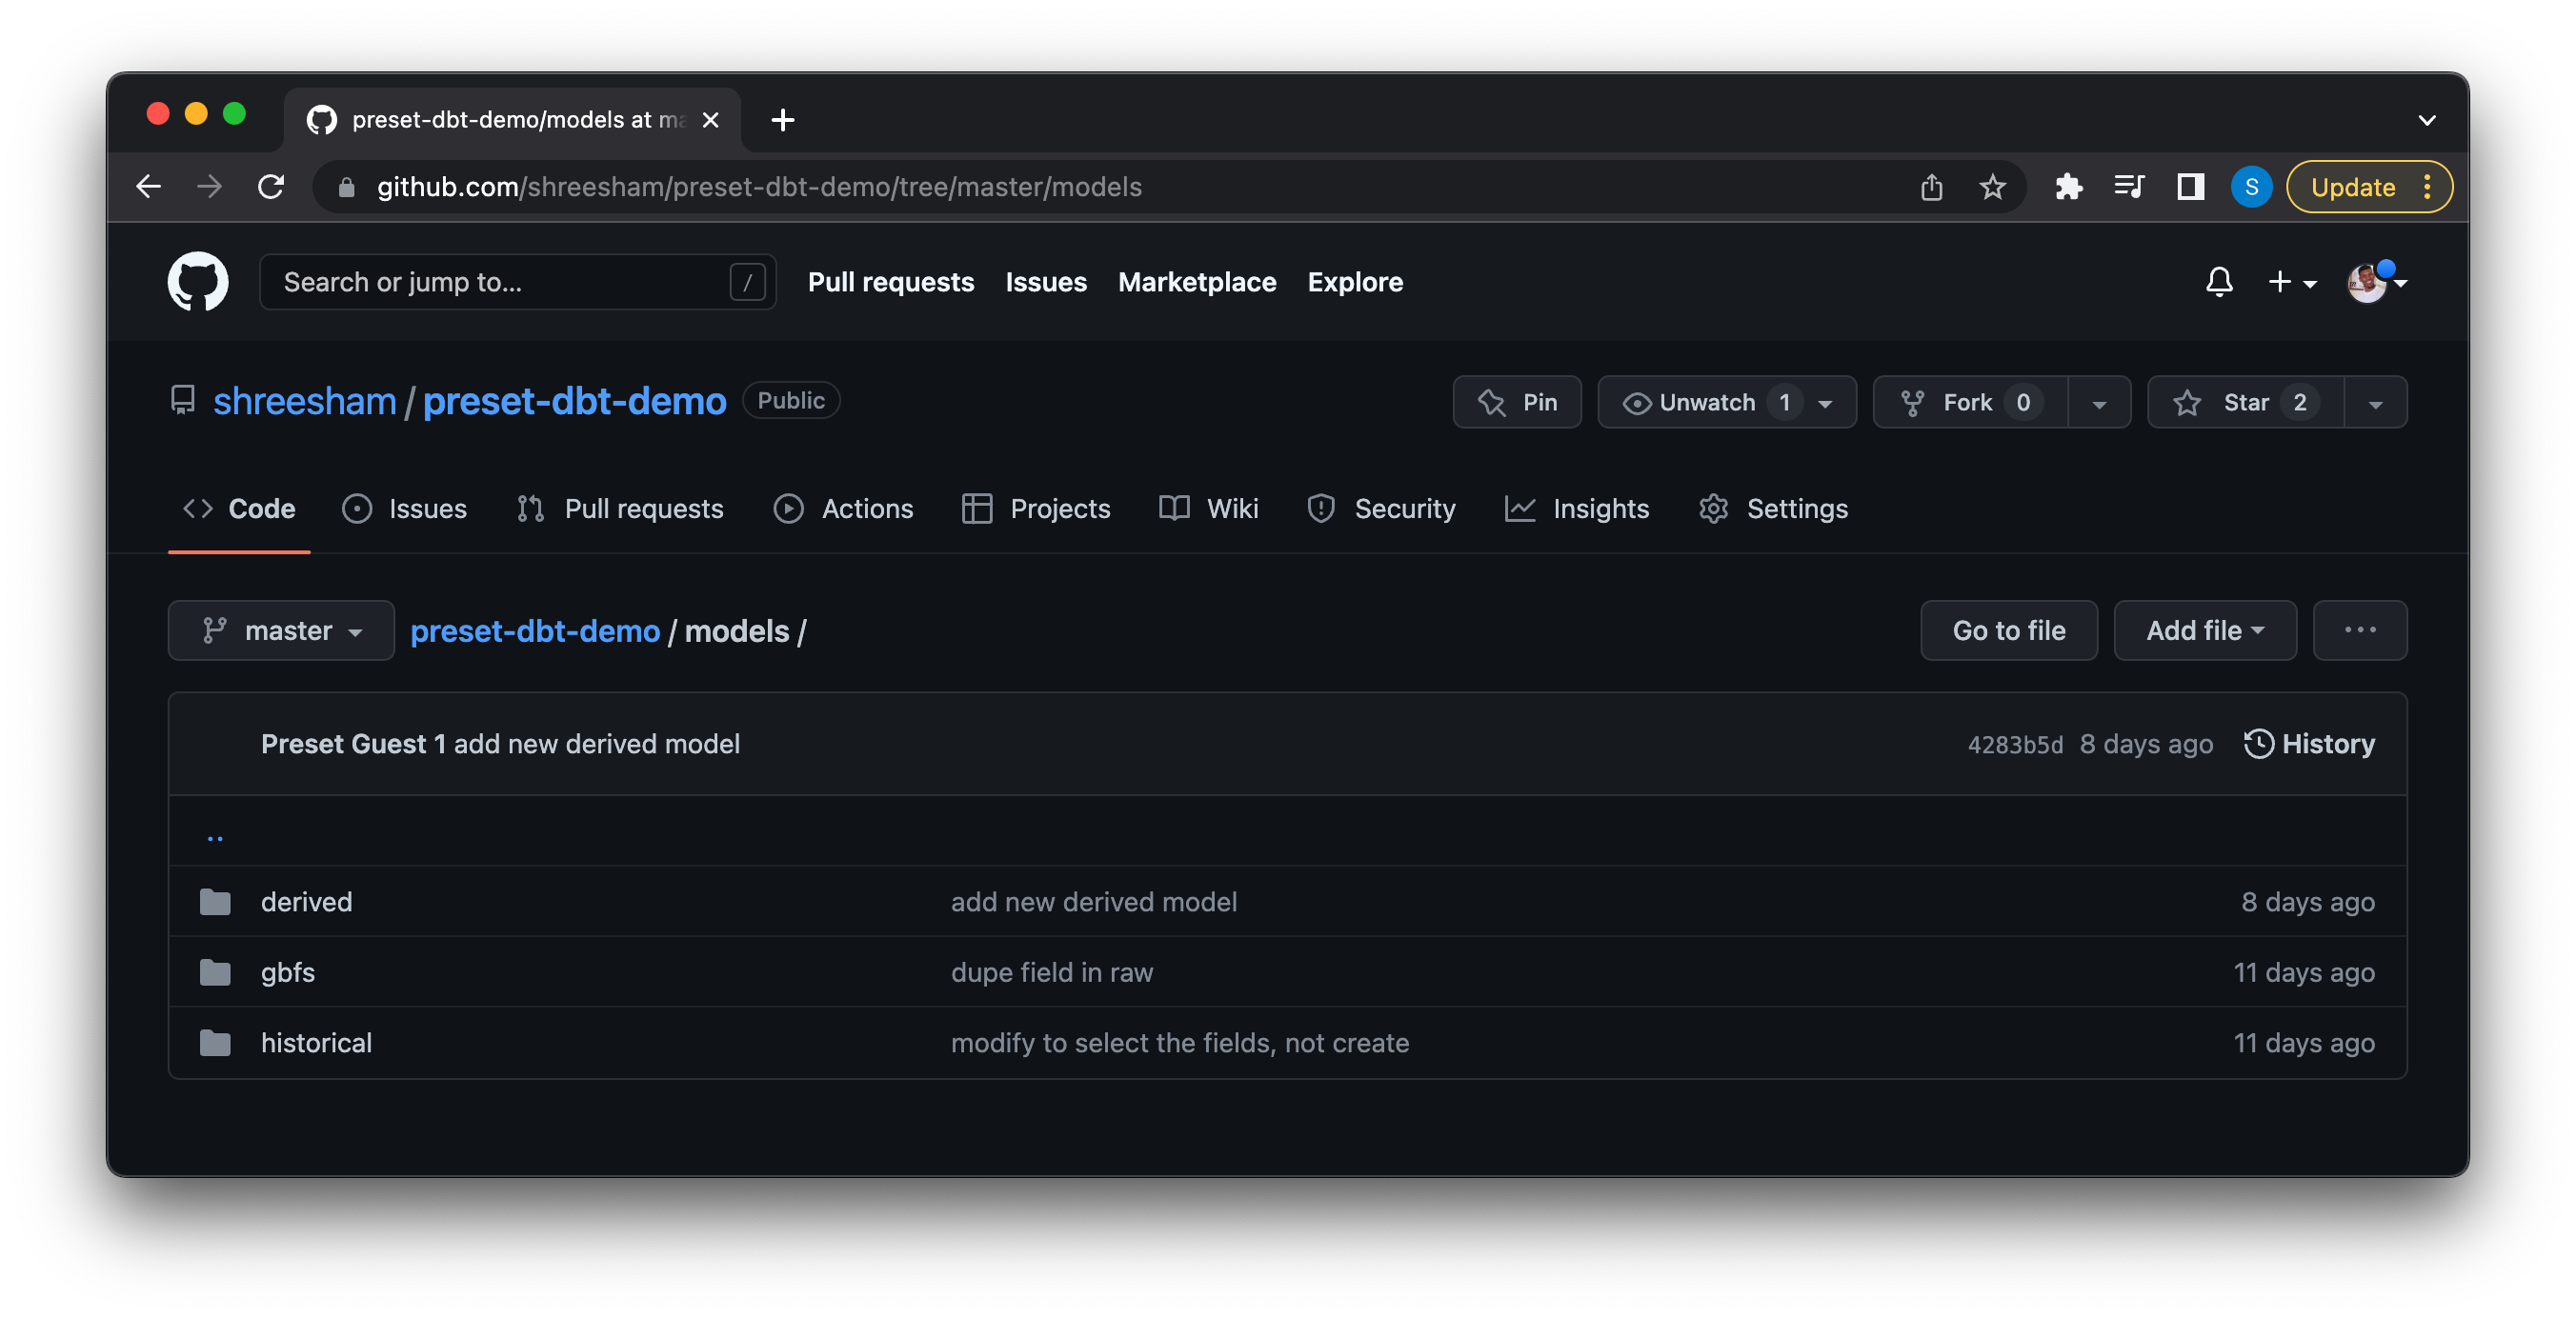
Each of these directories contain the SQL necessary to create the datasets we want to visualize with:
In this example we have a single historical model /models/historical/citibike_trips.sql:
{{ config(materialized='table') }}

select *
from citibike_trip_data.public.citibike_trips
which recreates the raw citibike trips table in our analytics database to be used to derive more specific datasets. Now we can begin deriving datasets based on this historical model!
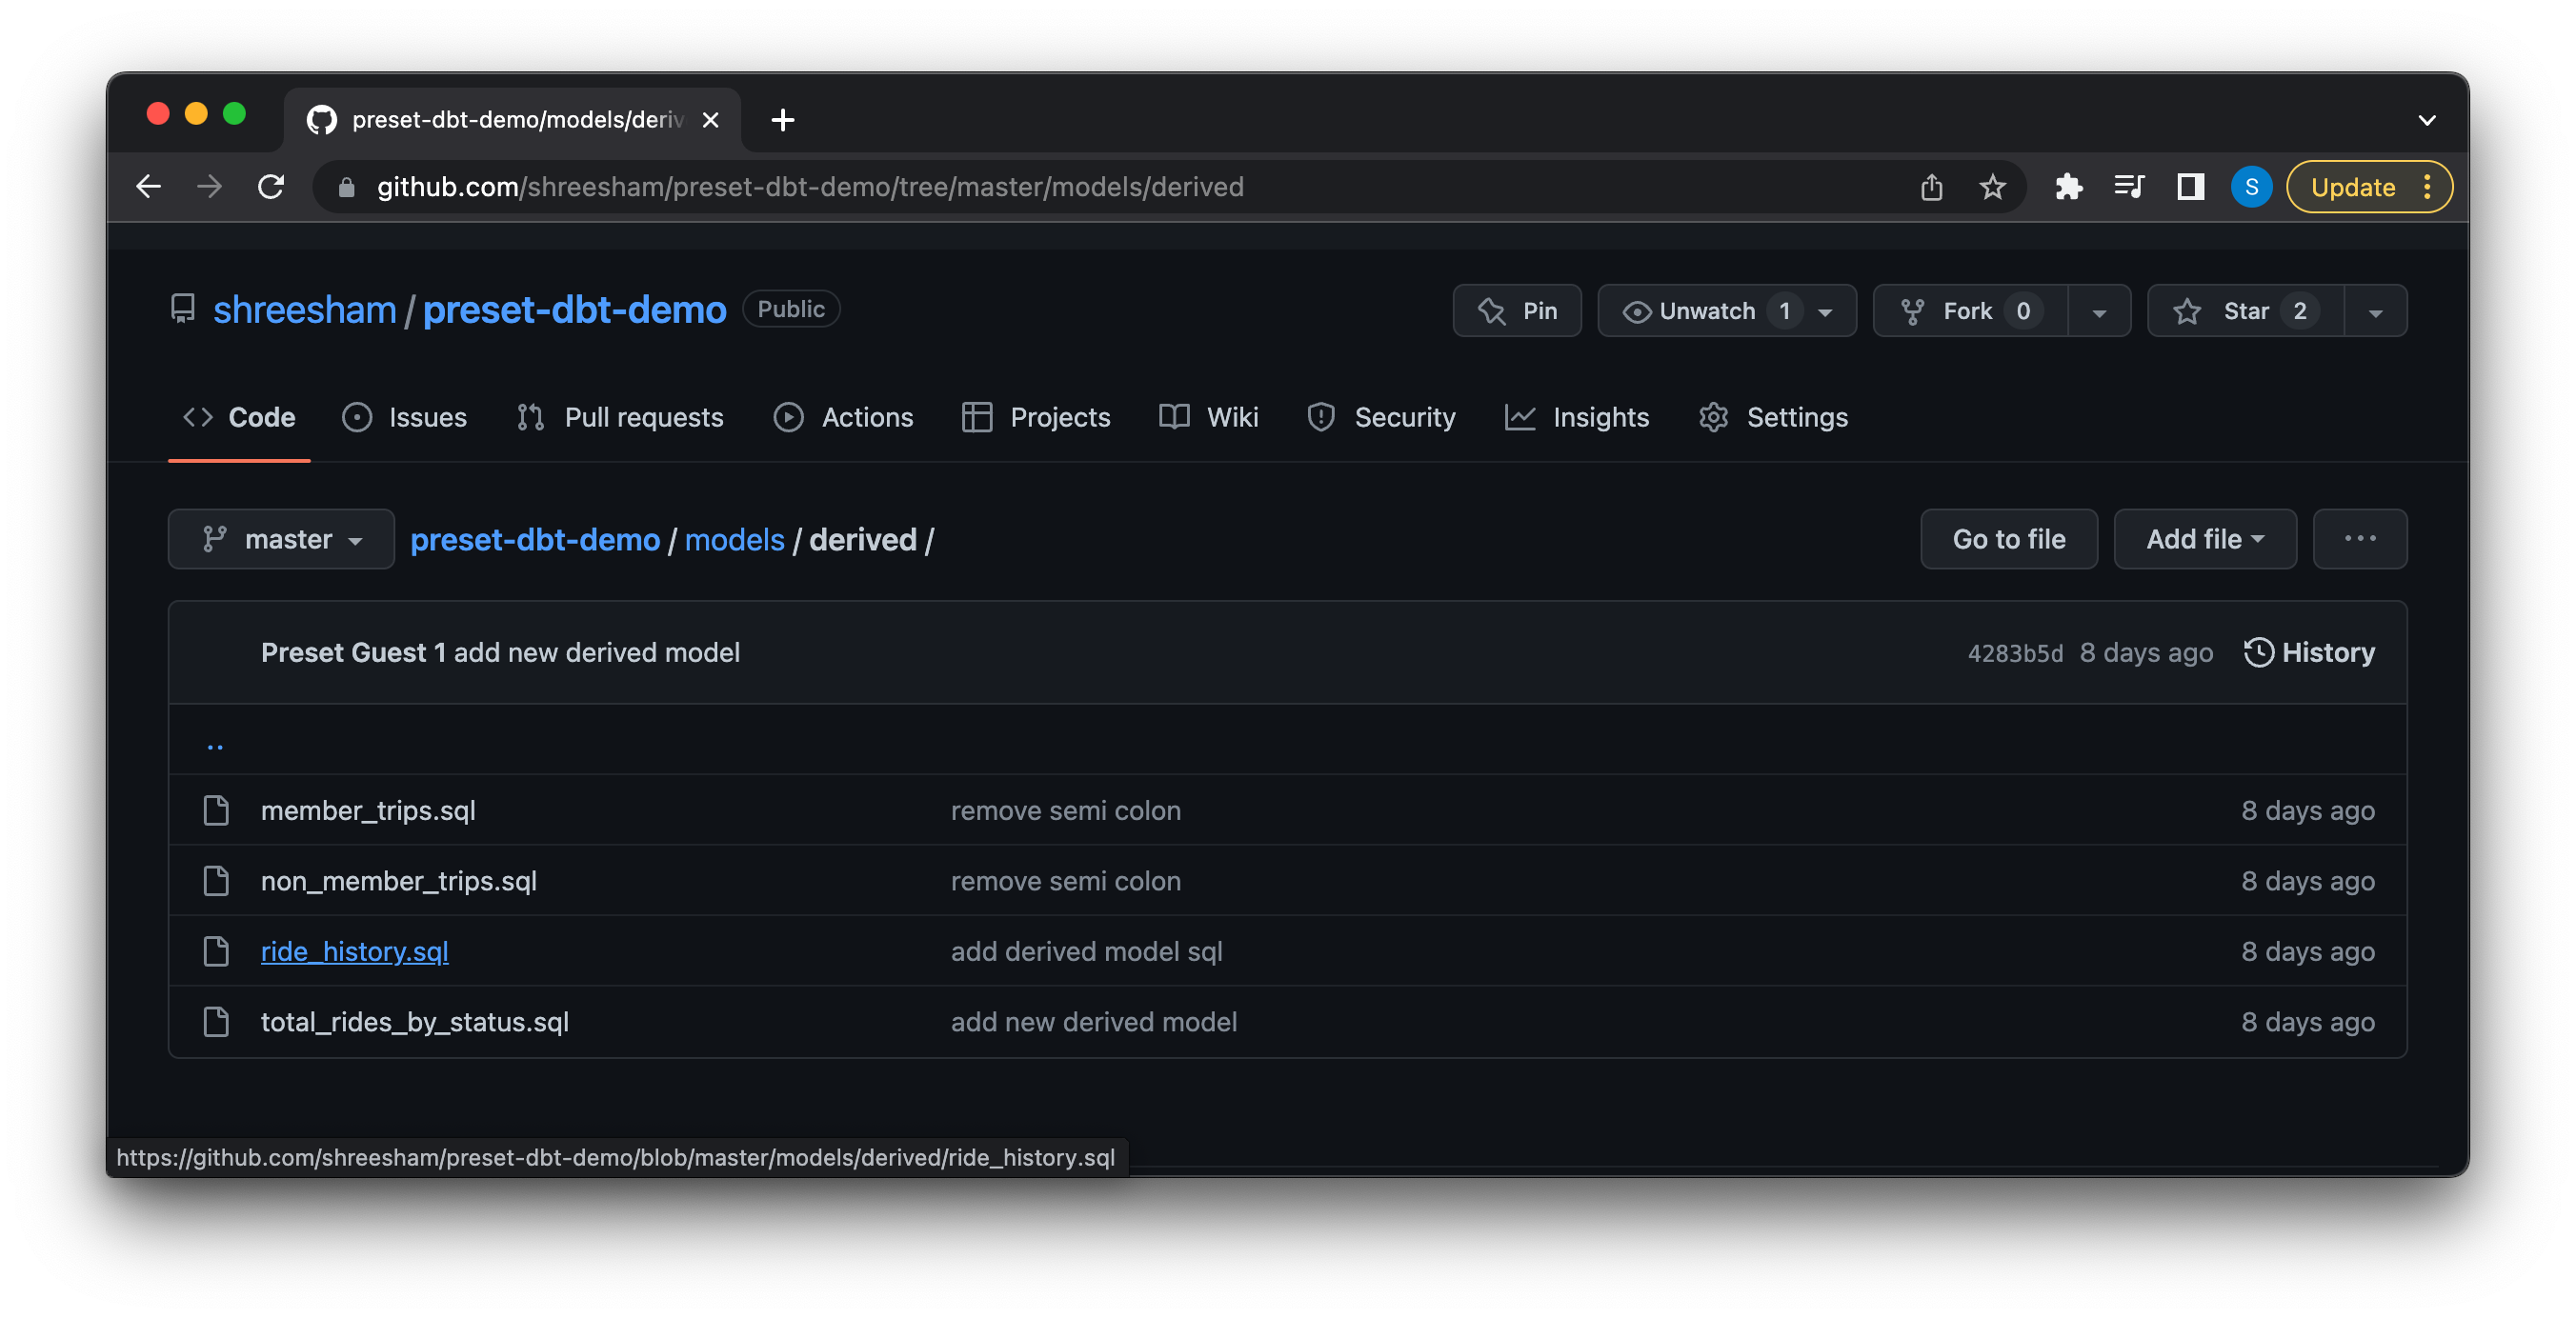
We have a derived model /models/derived/ride_history.sql:
{{ config(materialized='table') }}

select
    ride_id,
    start_station_name,
	  end_station_name,
	  started_at,
	  ended_at
from {{ ref('citibike_trips')}}
which is used to create a narrower table to only show the start and end locations and start and end time of a single ride.
We can also create datasets with pre-computed metrics, for example /models/derived/total_rides_by_status.sql creates a dataset that lets us look at the most popular start and end locations between members and non-members by counting the number of rides based on subscription type between any two stations.:
{{ config(materialized='table') }}

select
    count(ride_id) as total_rides,
    start_station_name,
    end_station_name,
    member_casual

from {{ ref('citibike_trips') }}

group by member_casual, start_station_name, end_station_name
Synchronizing dbt Resources to a Preset Workspace
Using the Preset CLI you can now synchronize these datasets back to Preset to build charts and dashboards off of. Before using the CLI to do this, ensure that your dbt project runs and you have generated a manifest.json file. The manifest file in dbt is the file that contains all the information about the project, models, datasets, metrics, etc. The way this synchronization works is by parsing the JSON file to extract the models and other dependencies and then utilizes the Superset API to recreate all of those in your Preset workspace.
First we use the dbt run command to verify all of our models build successfully:
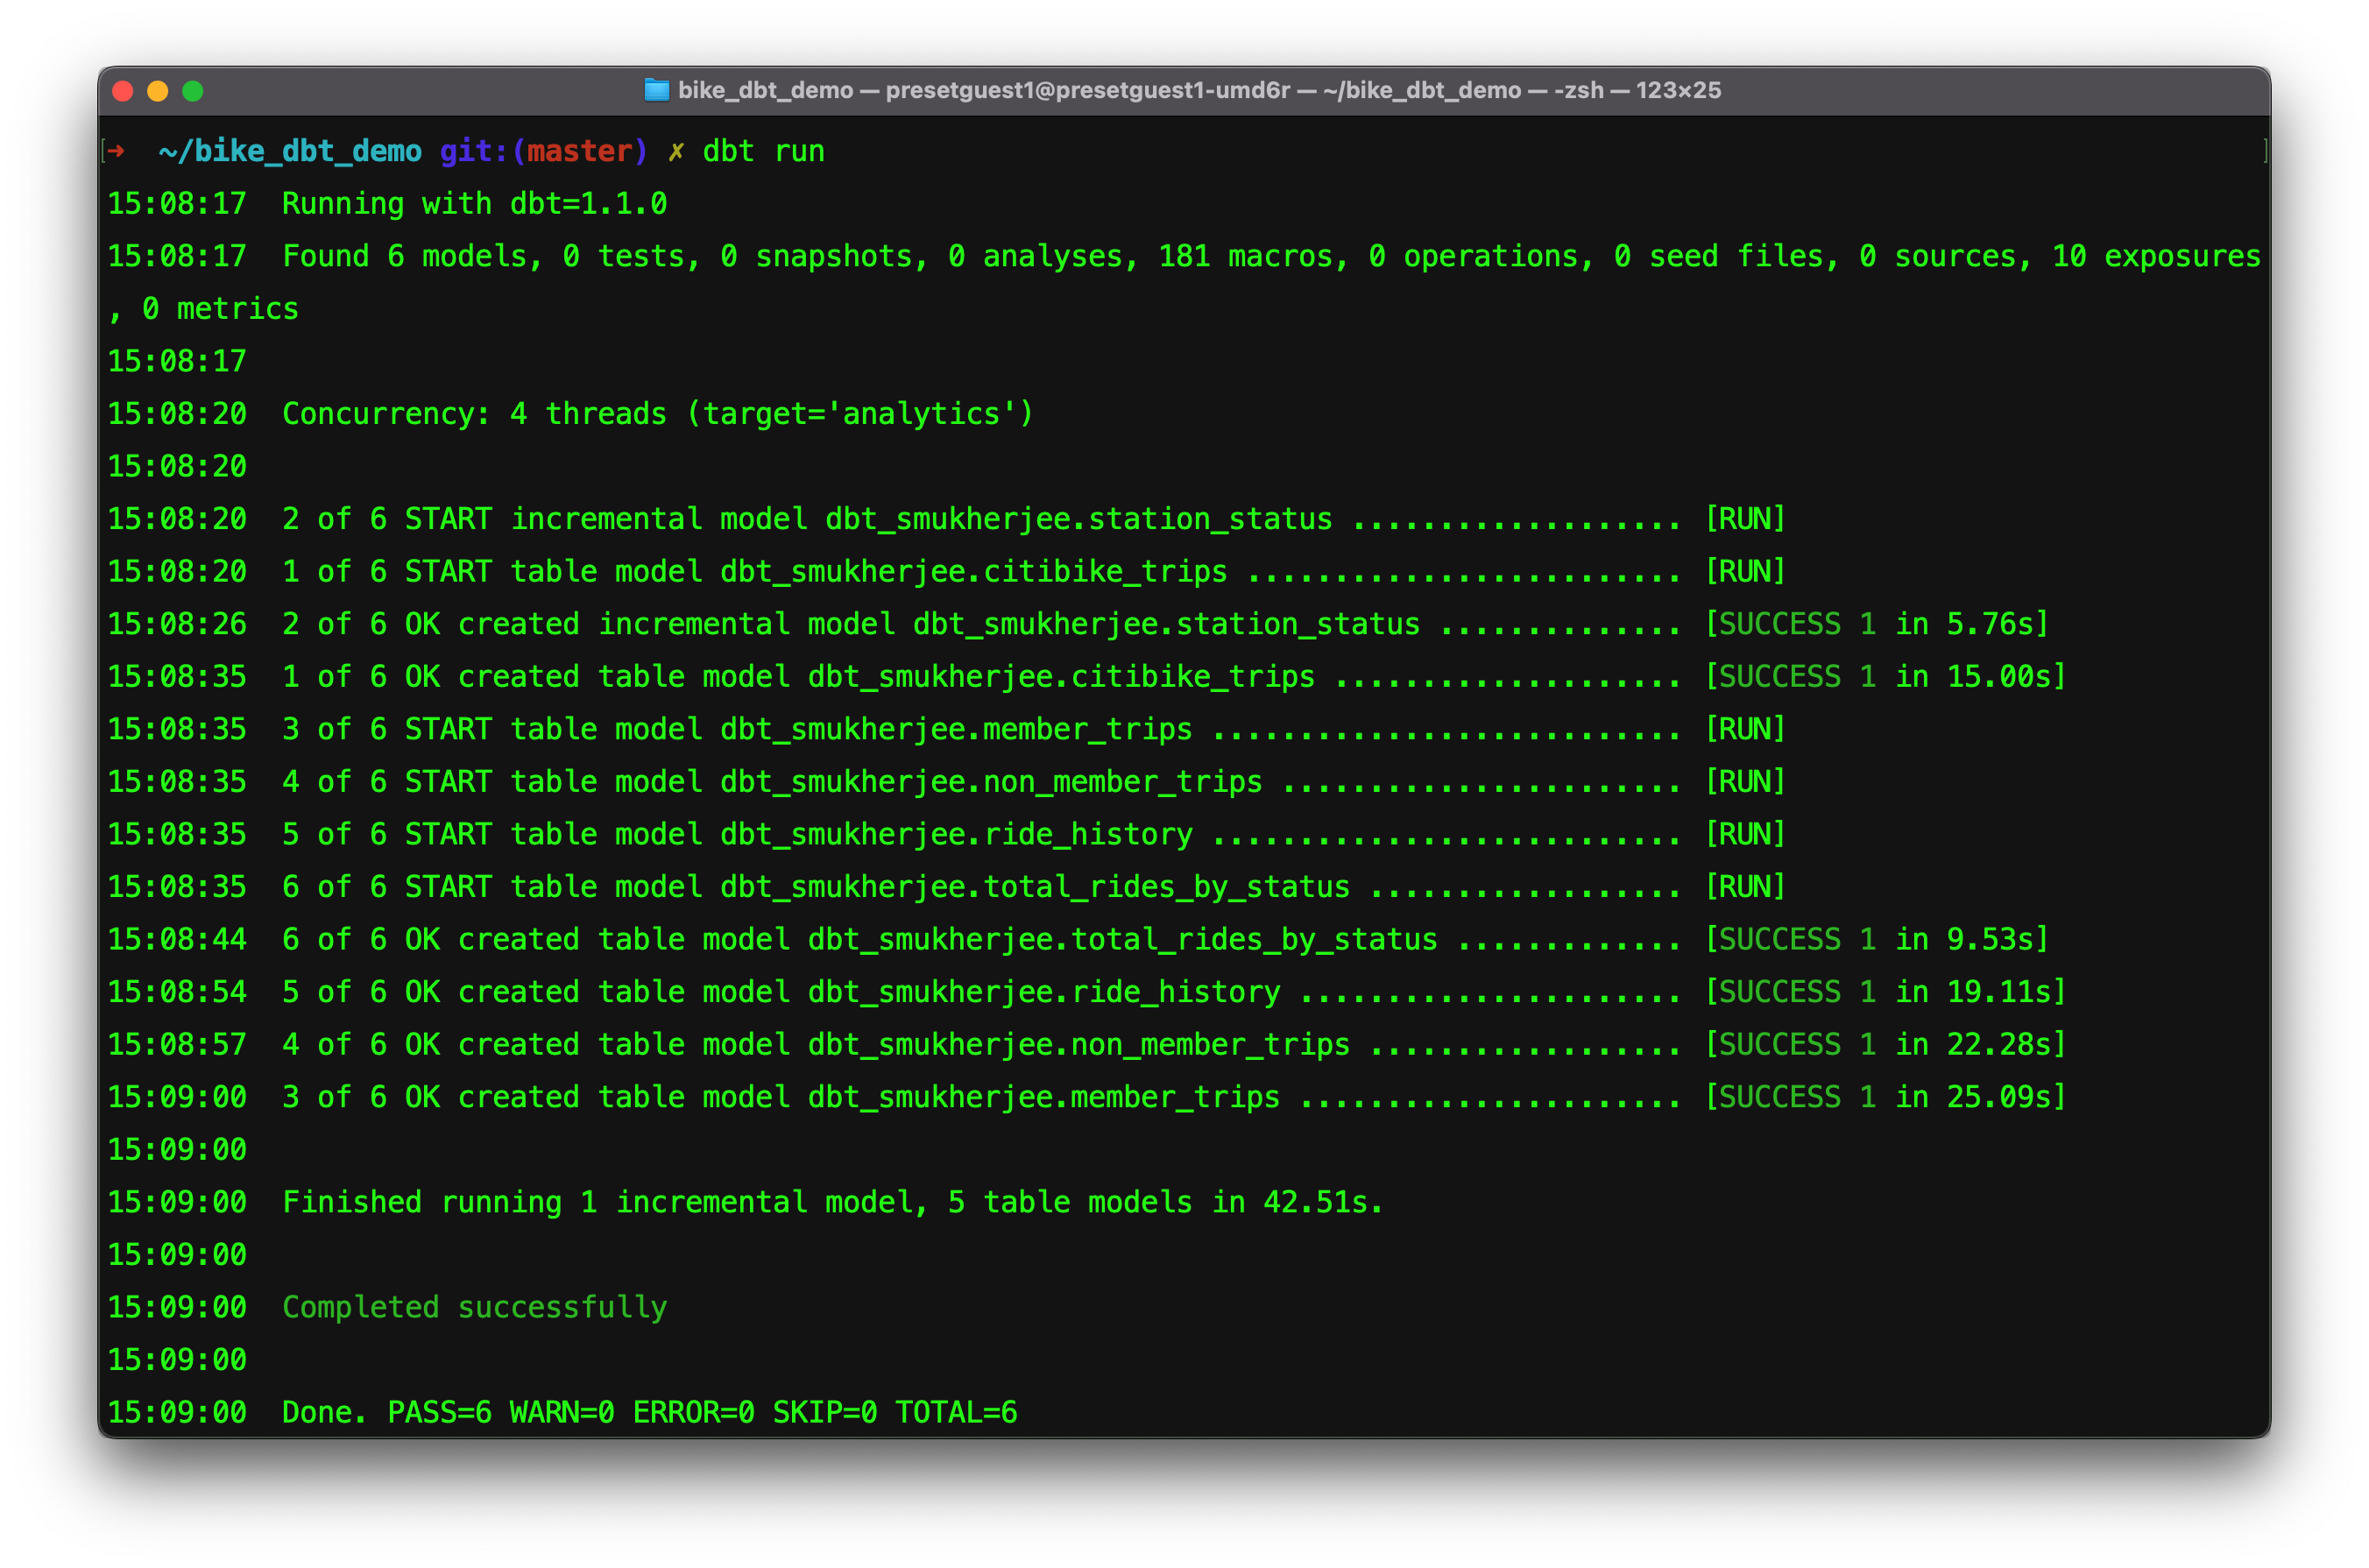
Confirm the manifest generation time by opening the file:
{
    "metadata":
    {
        "dbt_schema_version": "https://schemas.getdbt.com/dbt/manifest/v5.json",
        "dbt_version": "1.1.0",
        "generated_at": "2022-07-26T15:08:17.863129Z",
        "invocation_id": "c24d567c-668b-40df-b402-672b92ca7df1",
        "env":
        {},
        "project_id": "fac076c4cd33b3ec823e0d12ae461aed",
        "user_id": "816cbe26-15e8-4d3a-9519-4ffe571923df",
        "send_anonymous_usage_stats": true,
        "adapter_type": "snowflake"
    },
    "nodes":
    {
        "model.bike_dbt_demo.citibike_trips":
        {
            "raw_sql": "{{ config(materialized='table') }}\n    \nselect * \nfrom citibike_trip_data.public.citibike_trips",
            "compiled": true,
            "resource_type": "model",
            "depends_on":
            { ...
    ...
The generated_at field of metadata will show this.
Once we have our most up to date manifest file we can run the appropriate CLI command to sync these datasets into the workspace we want to create our dashboard in!
The command to run will look like:
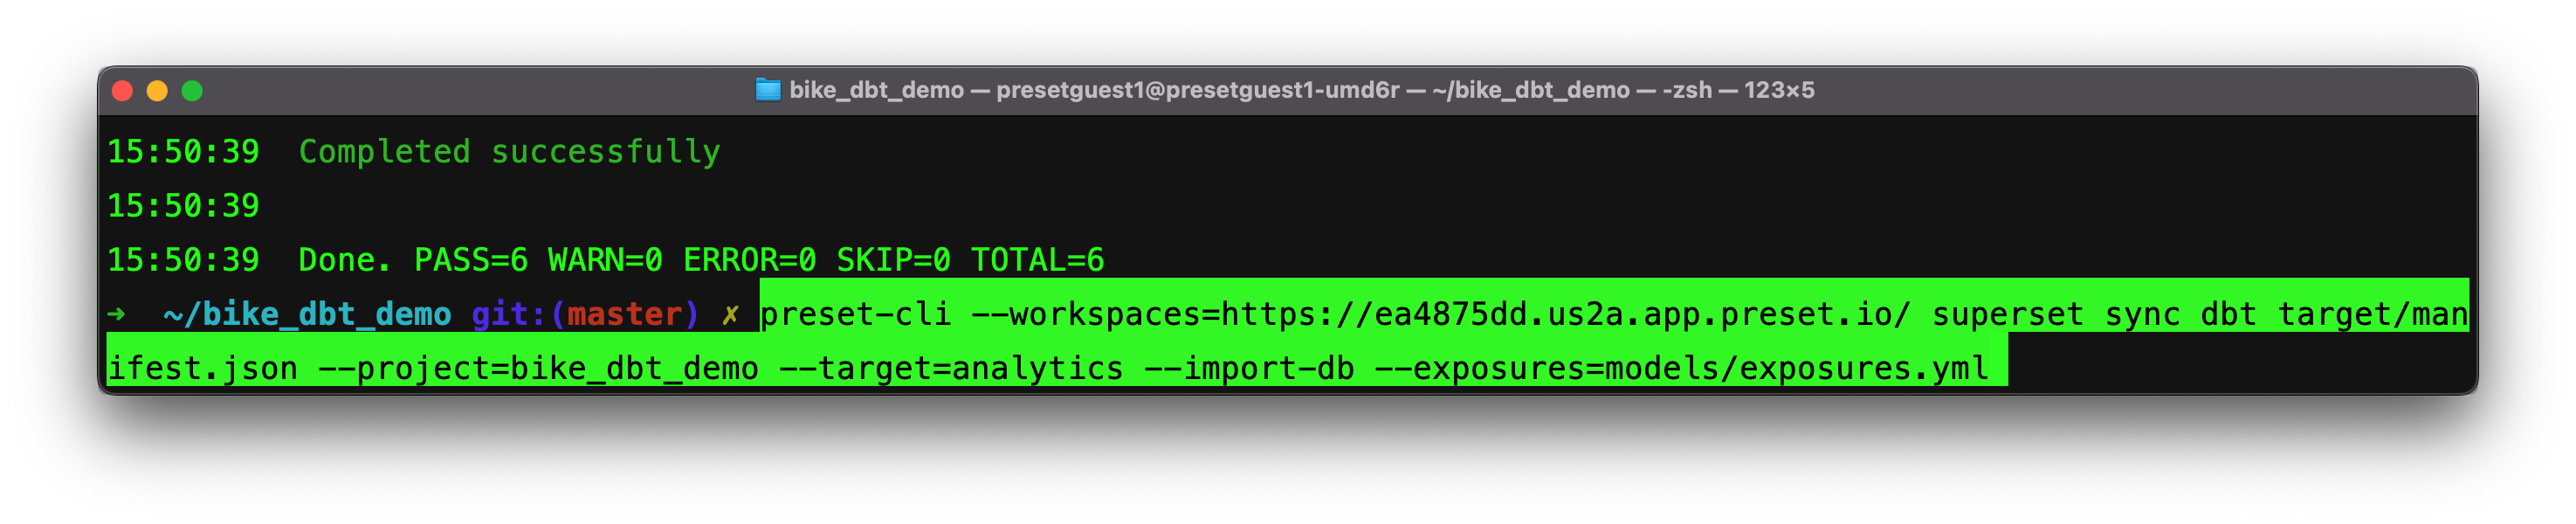
Breaking down the command above:
--workspace: Allows you to specify the workspace you want to target. This flag is not required, and if it is not provided users will be able to interactively select the workspaces they have access to.
superset sync dbt: The preset-clihas a series of subcommands for interacting with Superset instances (each Preset workspace is a Superset instance). This one is used to push assets from dbt.
target/manifest.json: The path to our compiled manifest file.
--project: Specifies which dbt project resources you’re syncing.
--target: Specifies the target database in your warehouse the dbt transformed models live in.
--import db: This flag indicates whether the associated database should be created in Preset, an idempotent command, it will inform you whether the database already exists as well!
--exposures: This flag allows you to synchronize assets like charts or dashboards back to dbt as an exposure. Once you’ve built a dashboard on your dbt datasets this file is valuable for generating data lineage documentation that includes your dashboards. Exposures in dbt make it possible to define and describe a downstream use of your dbt project, such as in a dashboard, application, or data science pipeline. If the exposures file does not exist, it will be created for you!
Running the command we see:
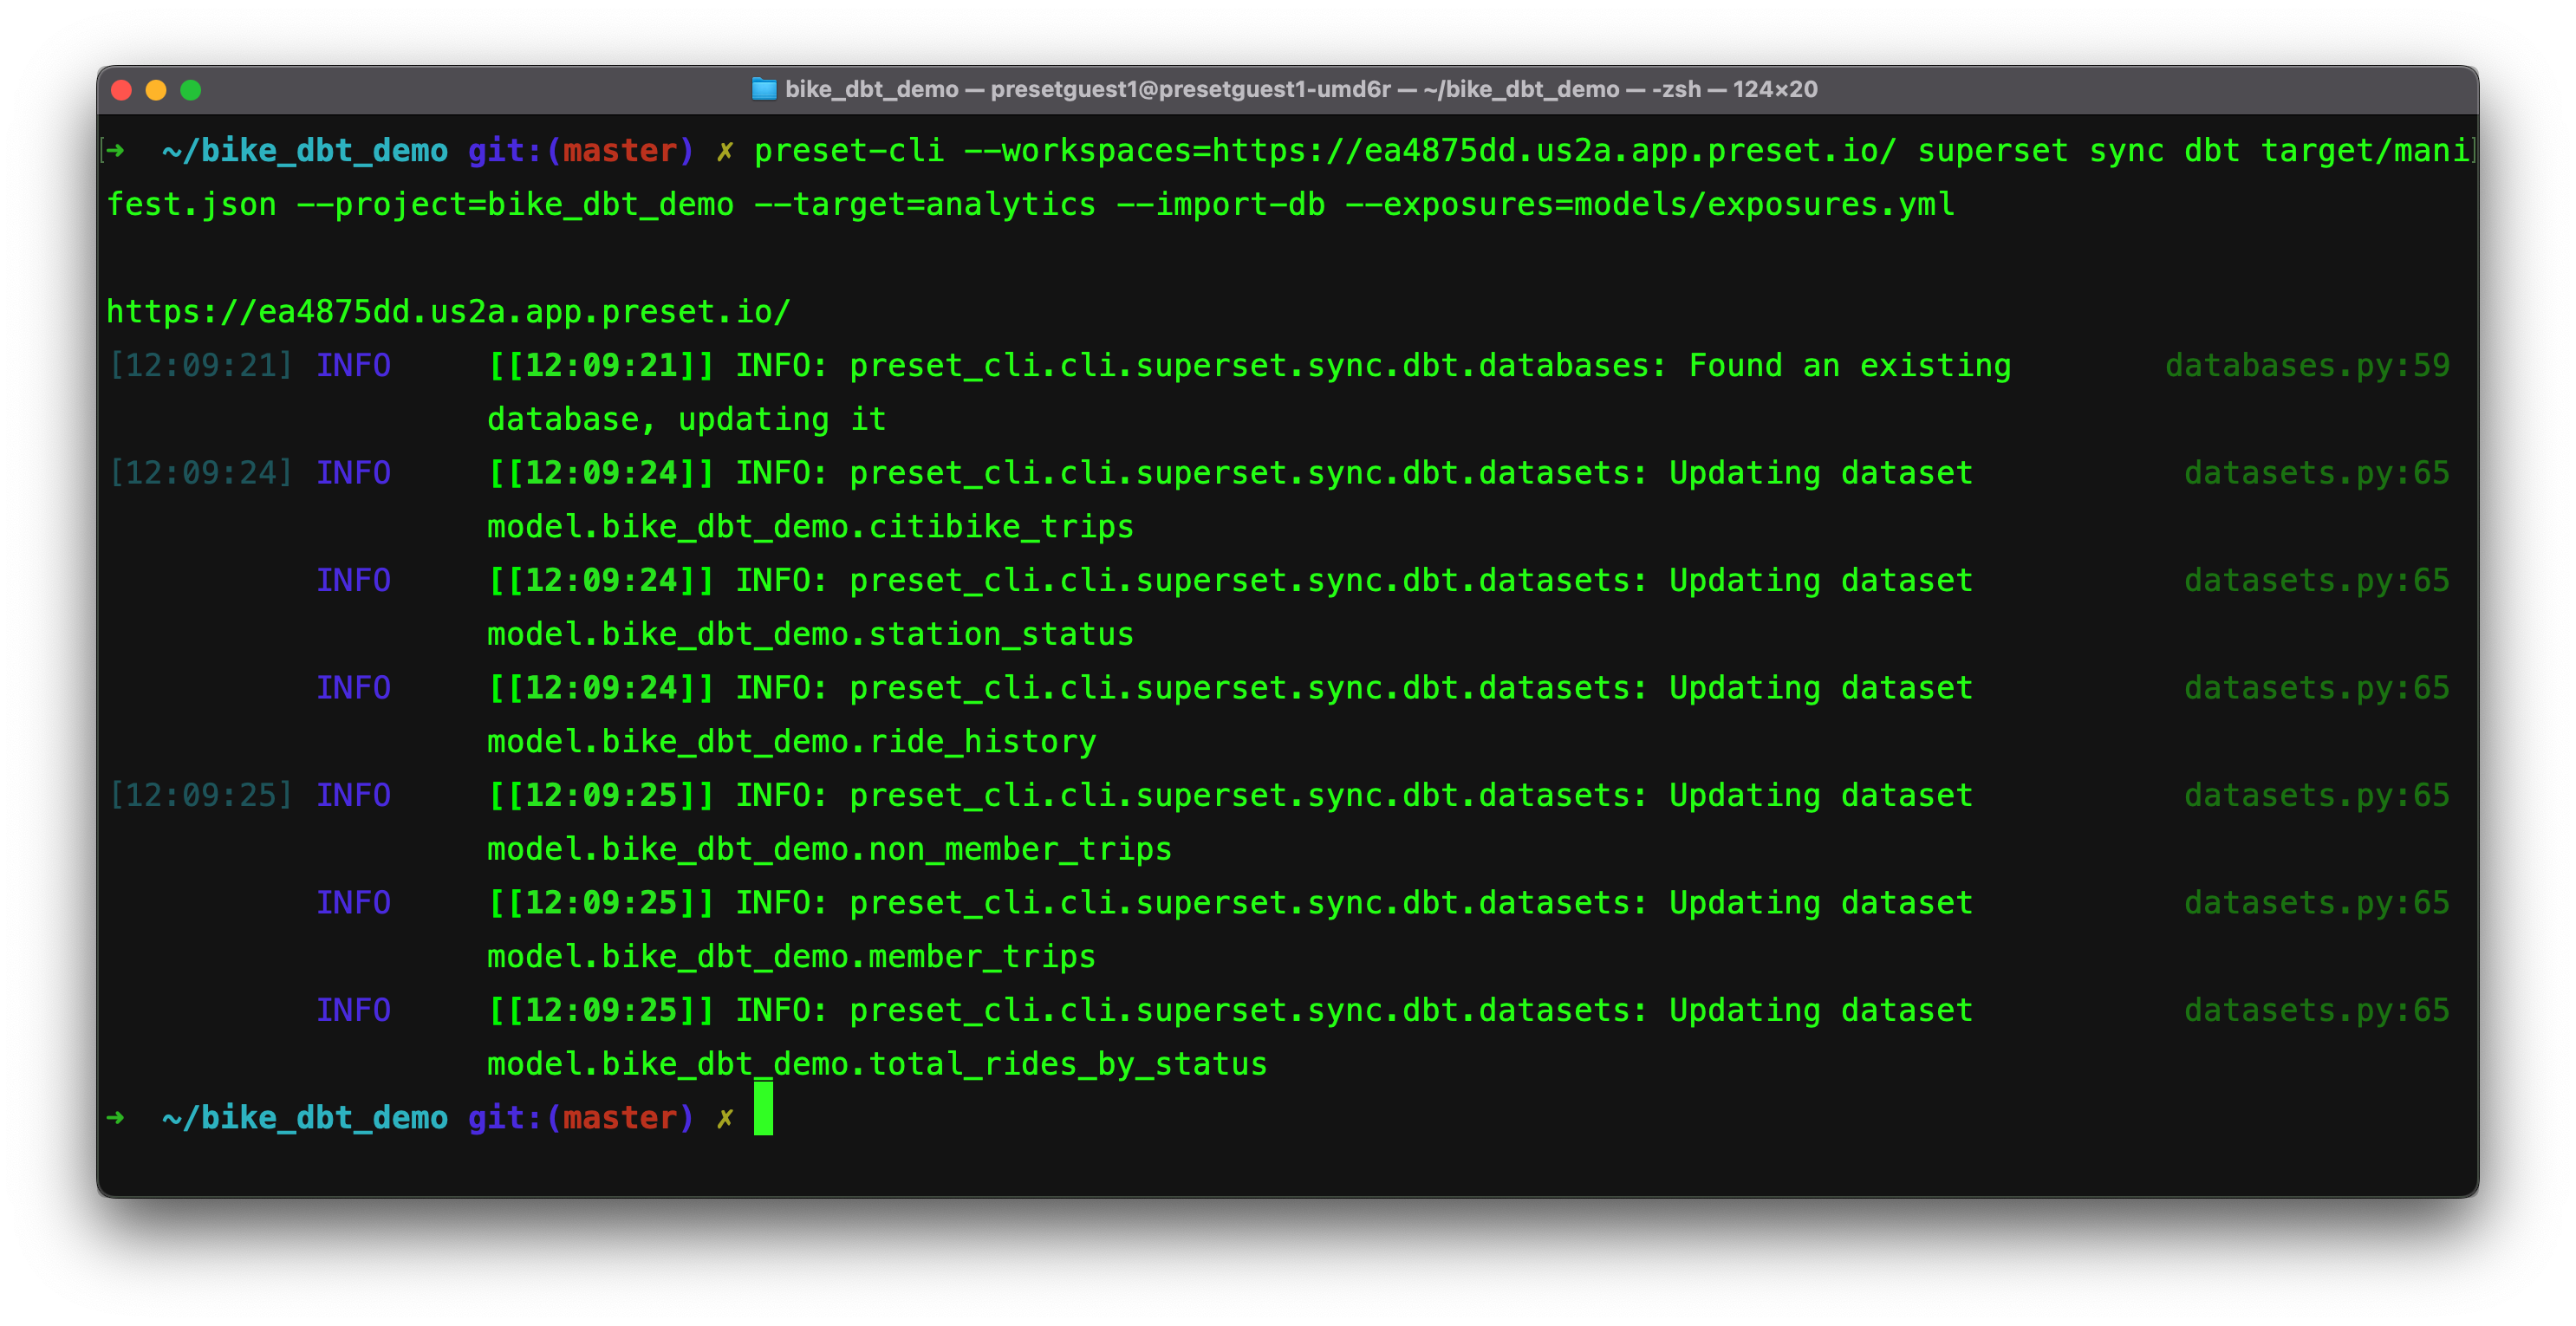
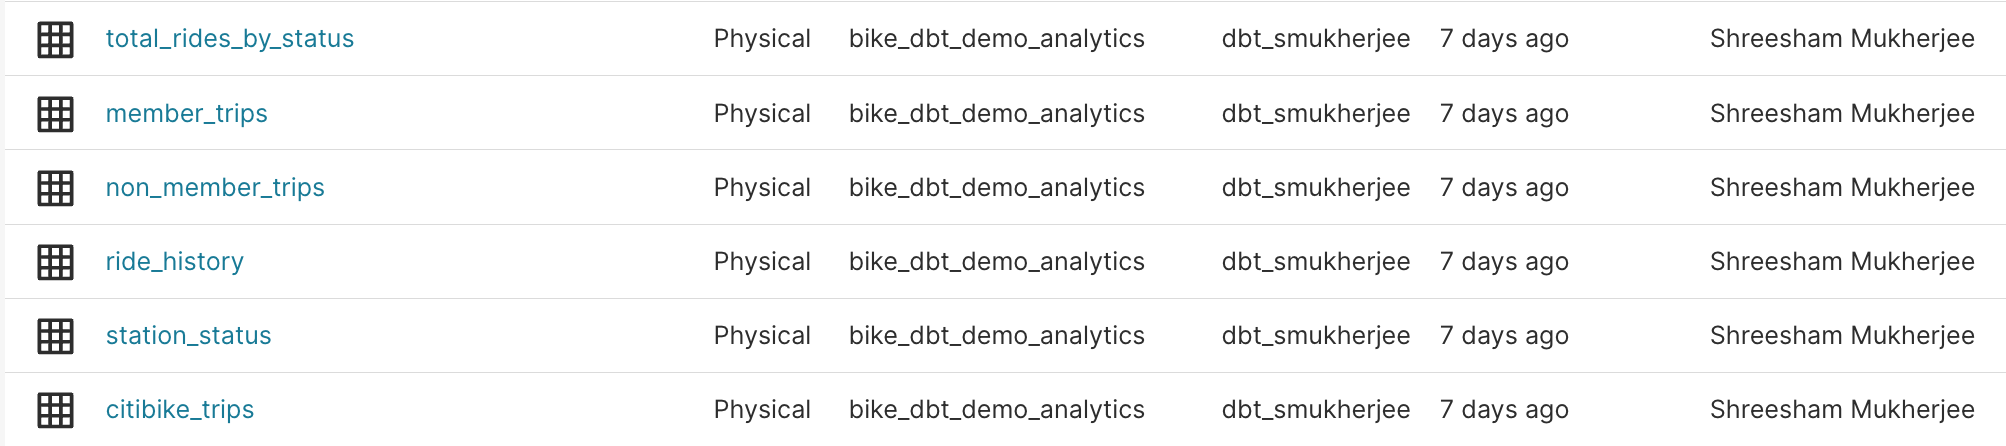
We can see the results in our workspace:

the database is now connected to our specified workspace and all of the models from our analytics database are now available as datasets:
Now we confirm that we also have our exposures file that looks something like:
version: 2
exposures:
- name: Total Citi Bike Member Rides [chart]
  type: analysis
  maturity: low
  url: https://ea4875dd.us2a.app.preset.io/superset/explore/?form_data=%7B%22slice_id%22:+96%7D
  description: ''
  depends_on:
  - ref('member_trips')
  owner:
    name: Shreesham Mukherjee
    email: unknown
- name: Total Citi Bike Casual Rides [chart]
  type: analysis
  maturity: low
  url: https://ea4875dd.us2a.app.preset.io/superset/explore/?form_data=%7B%22slice_id%22:+97%7D
  description: ''
  depends_on:
  - ref('non_member_trips')
  owner:
    name: ......

...

- name: Citi Bike Rides [dashboard]
  type: dashboard
  maturity: high
  url: https://ea4875dd.us2a.app.preset.io/superset/dashboard/10/
  description: ''
  depends_on:
  - ref('citibike_trips')
  - ref('ride_history')
  - ref('member_trips')
  - ref('non_member_trips')
  - ref('total_rides_by_status')
  owner:
    name: Shreesham Mukherjee
    email: unknown
and we can see how our charts and dashboard are now defined as downstream consumers of our models!
Now we run dbt compile, dbt docs generate, then dbt docs serve to see our lineage graph:
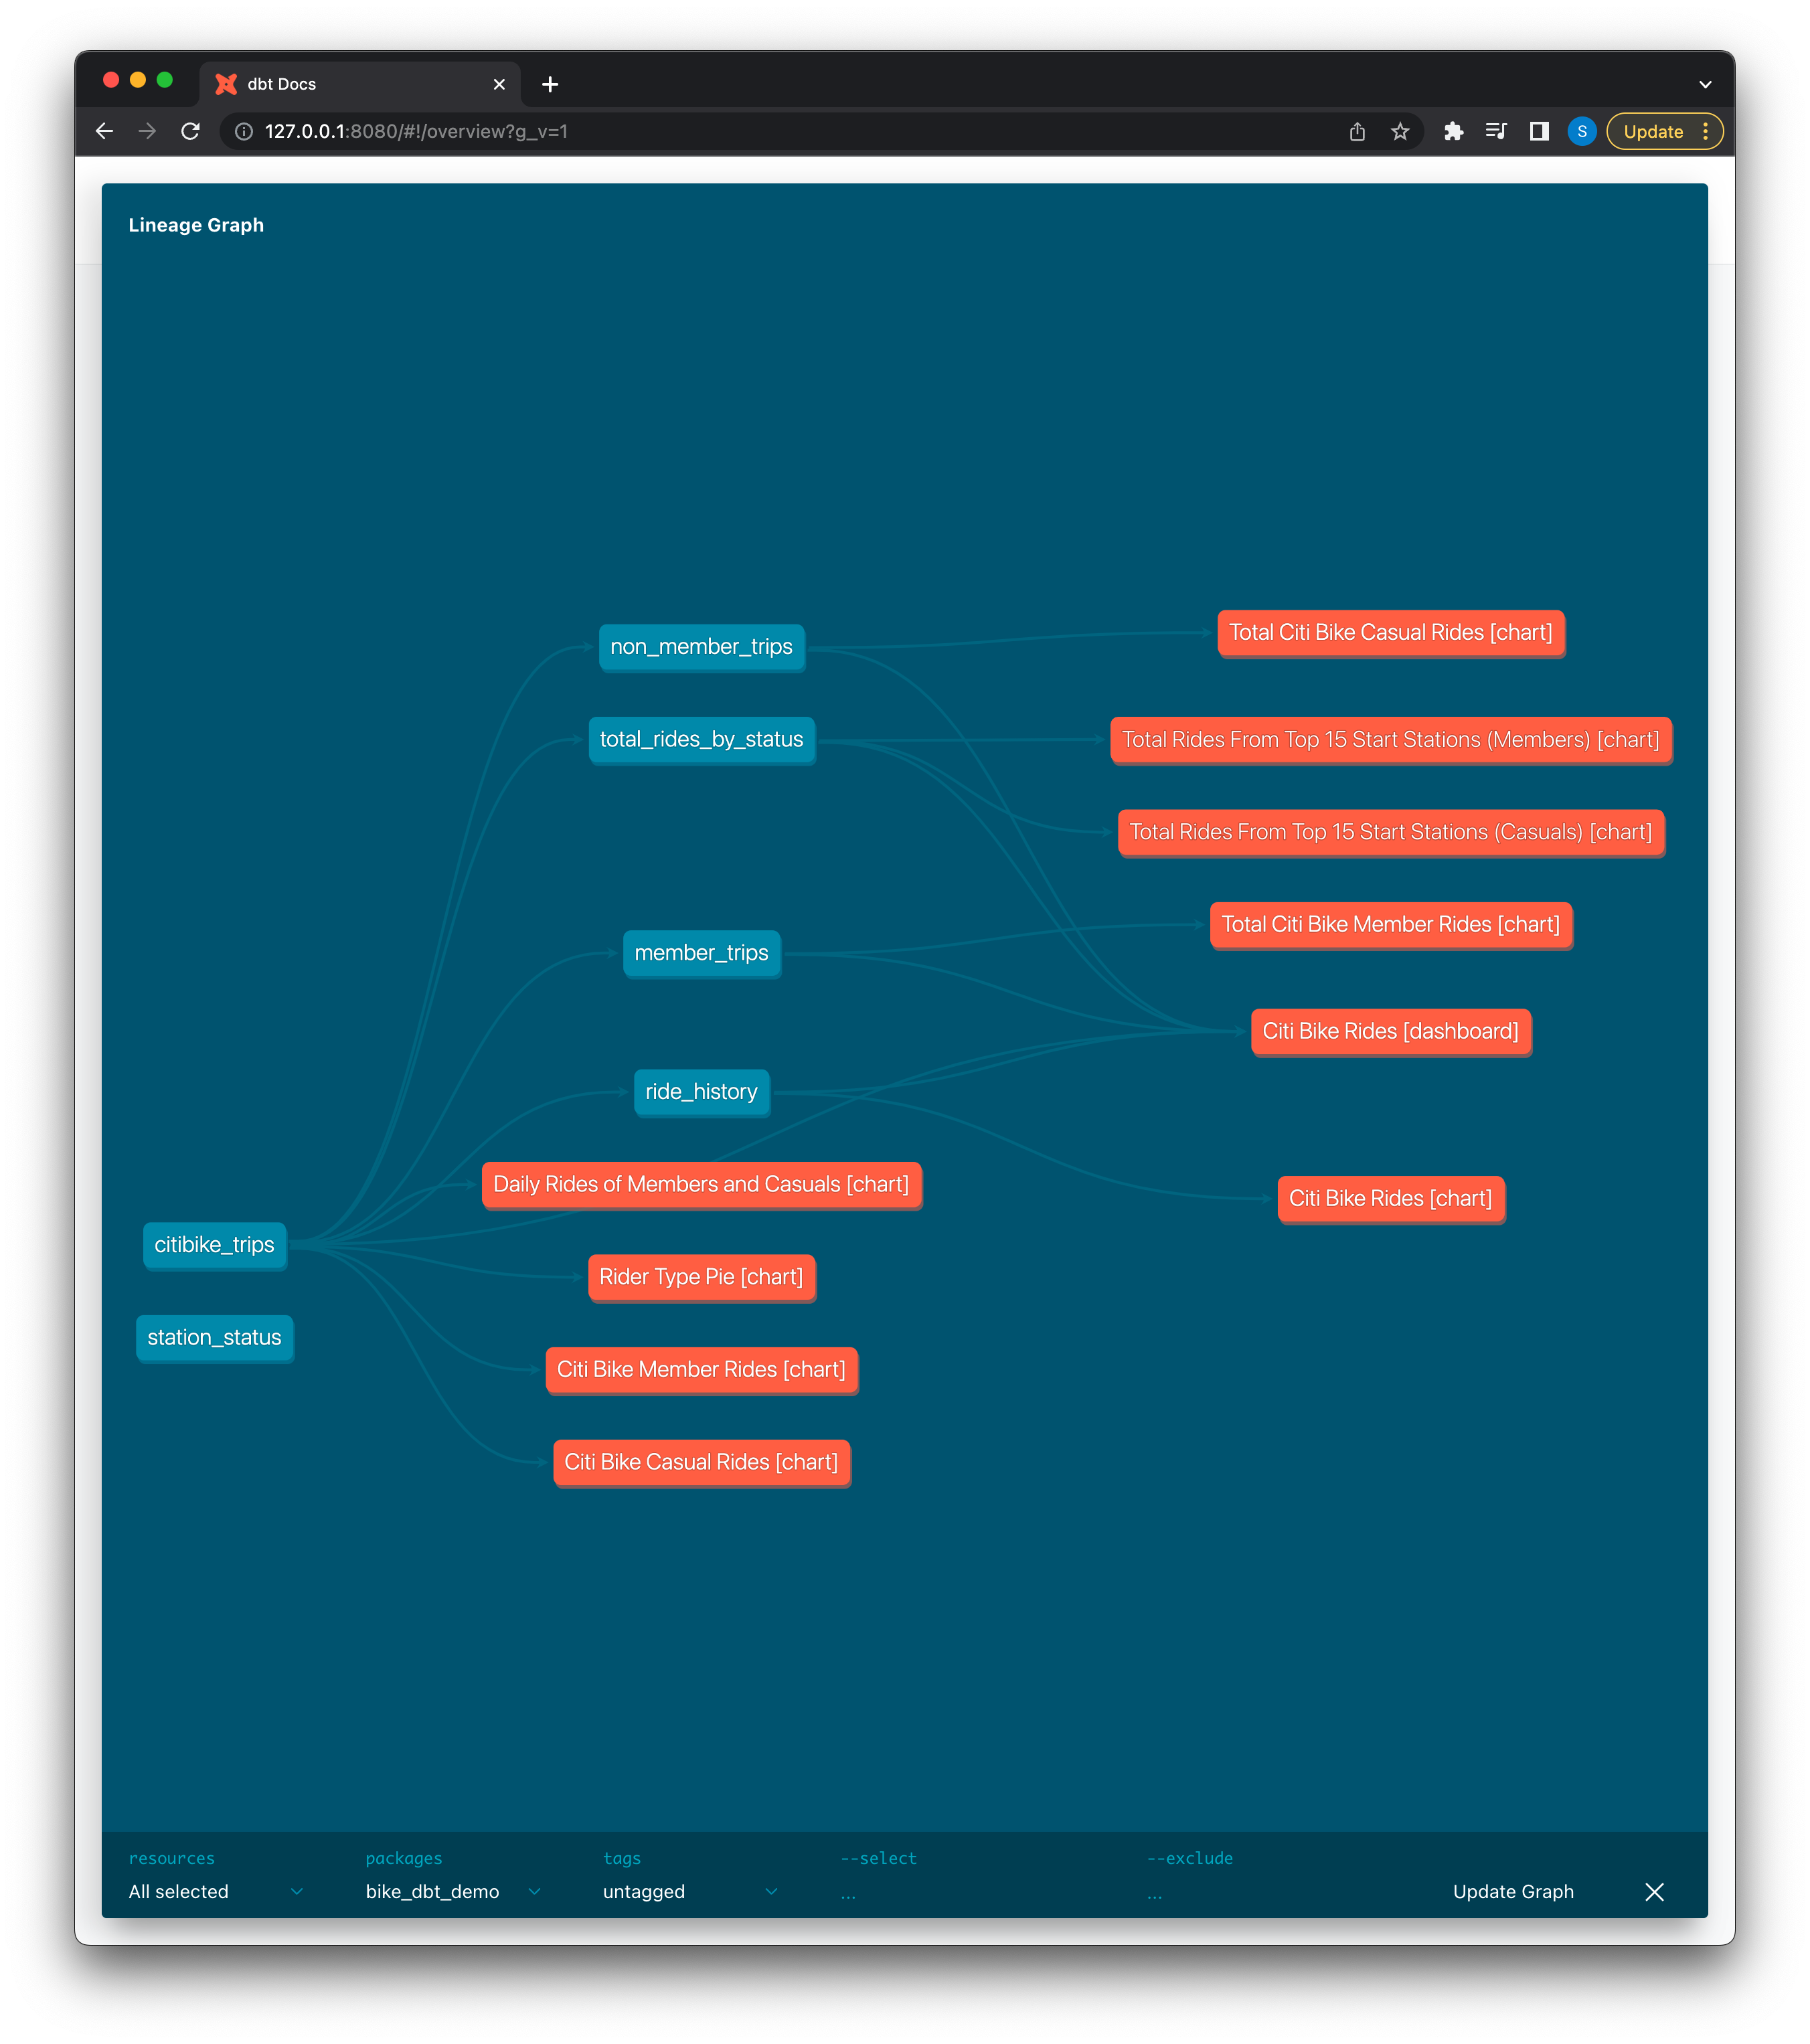
In dbt lineage graphs, all exposures are represented as orange nodes. Synchronizing Preset charts and dashboards back as exposures is an incredibly valuable way of keeping track of which models are being consumed downstream of dbt!
Managing Dashboards as Code
Up to this point we’ve successfully managed all of our datasets and models as code with source control using Git. This allows us to trust the data — we know it won’t be changing or modified without going through a proper code review process (in theory).
Now what if we want to apply these same principles of data management to our dashboard or charts themselves to prevent changes or modifications? We can export any dashboard or chart directly though Preset:
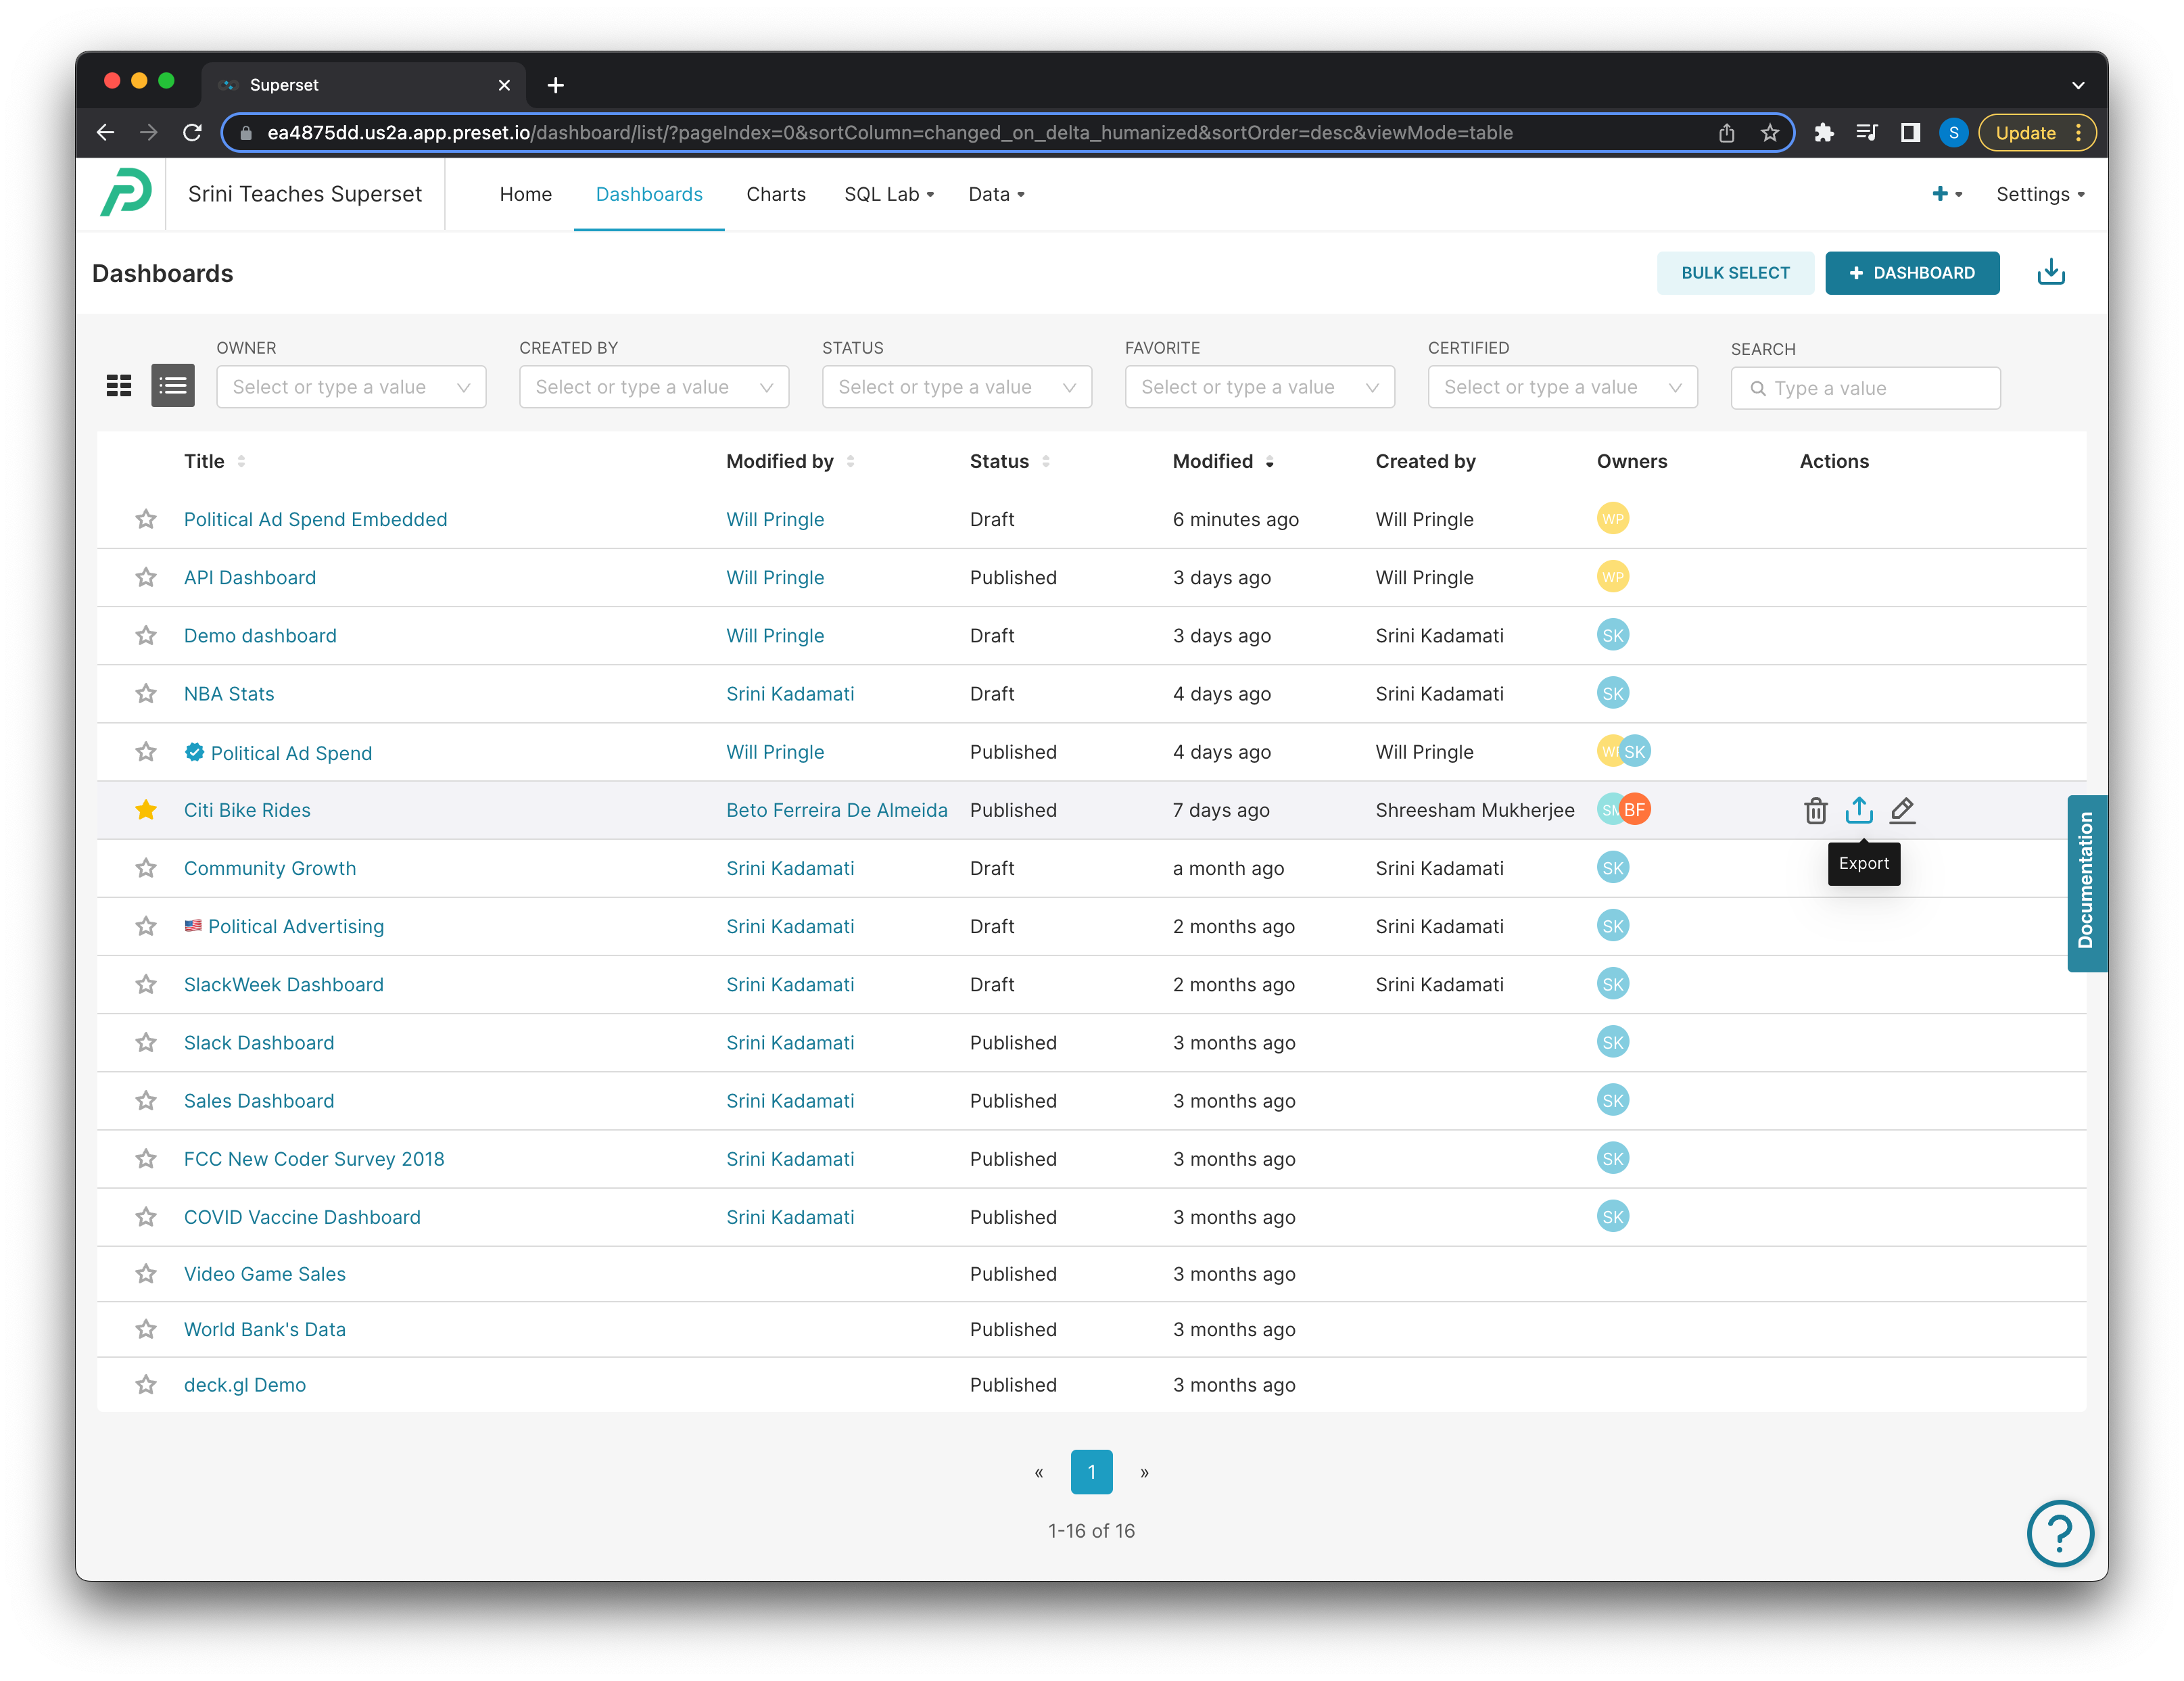
The export will return a zip file with a definition of the dashboard as a YAML file, and will also contain definitions for all the dependent assets — every chart in the dashboard, every dataset the charts depend on, and the database those datasets come from:
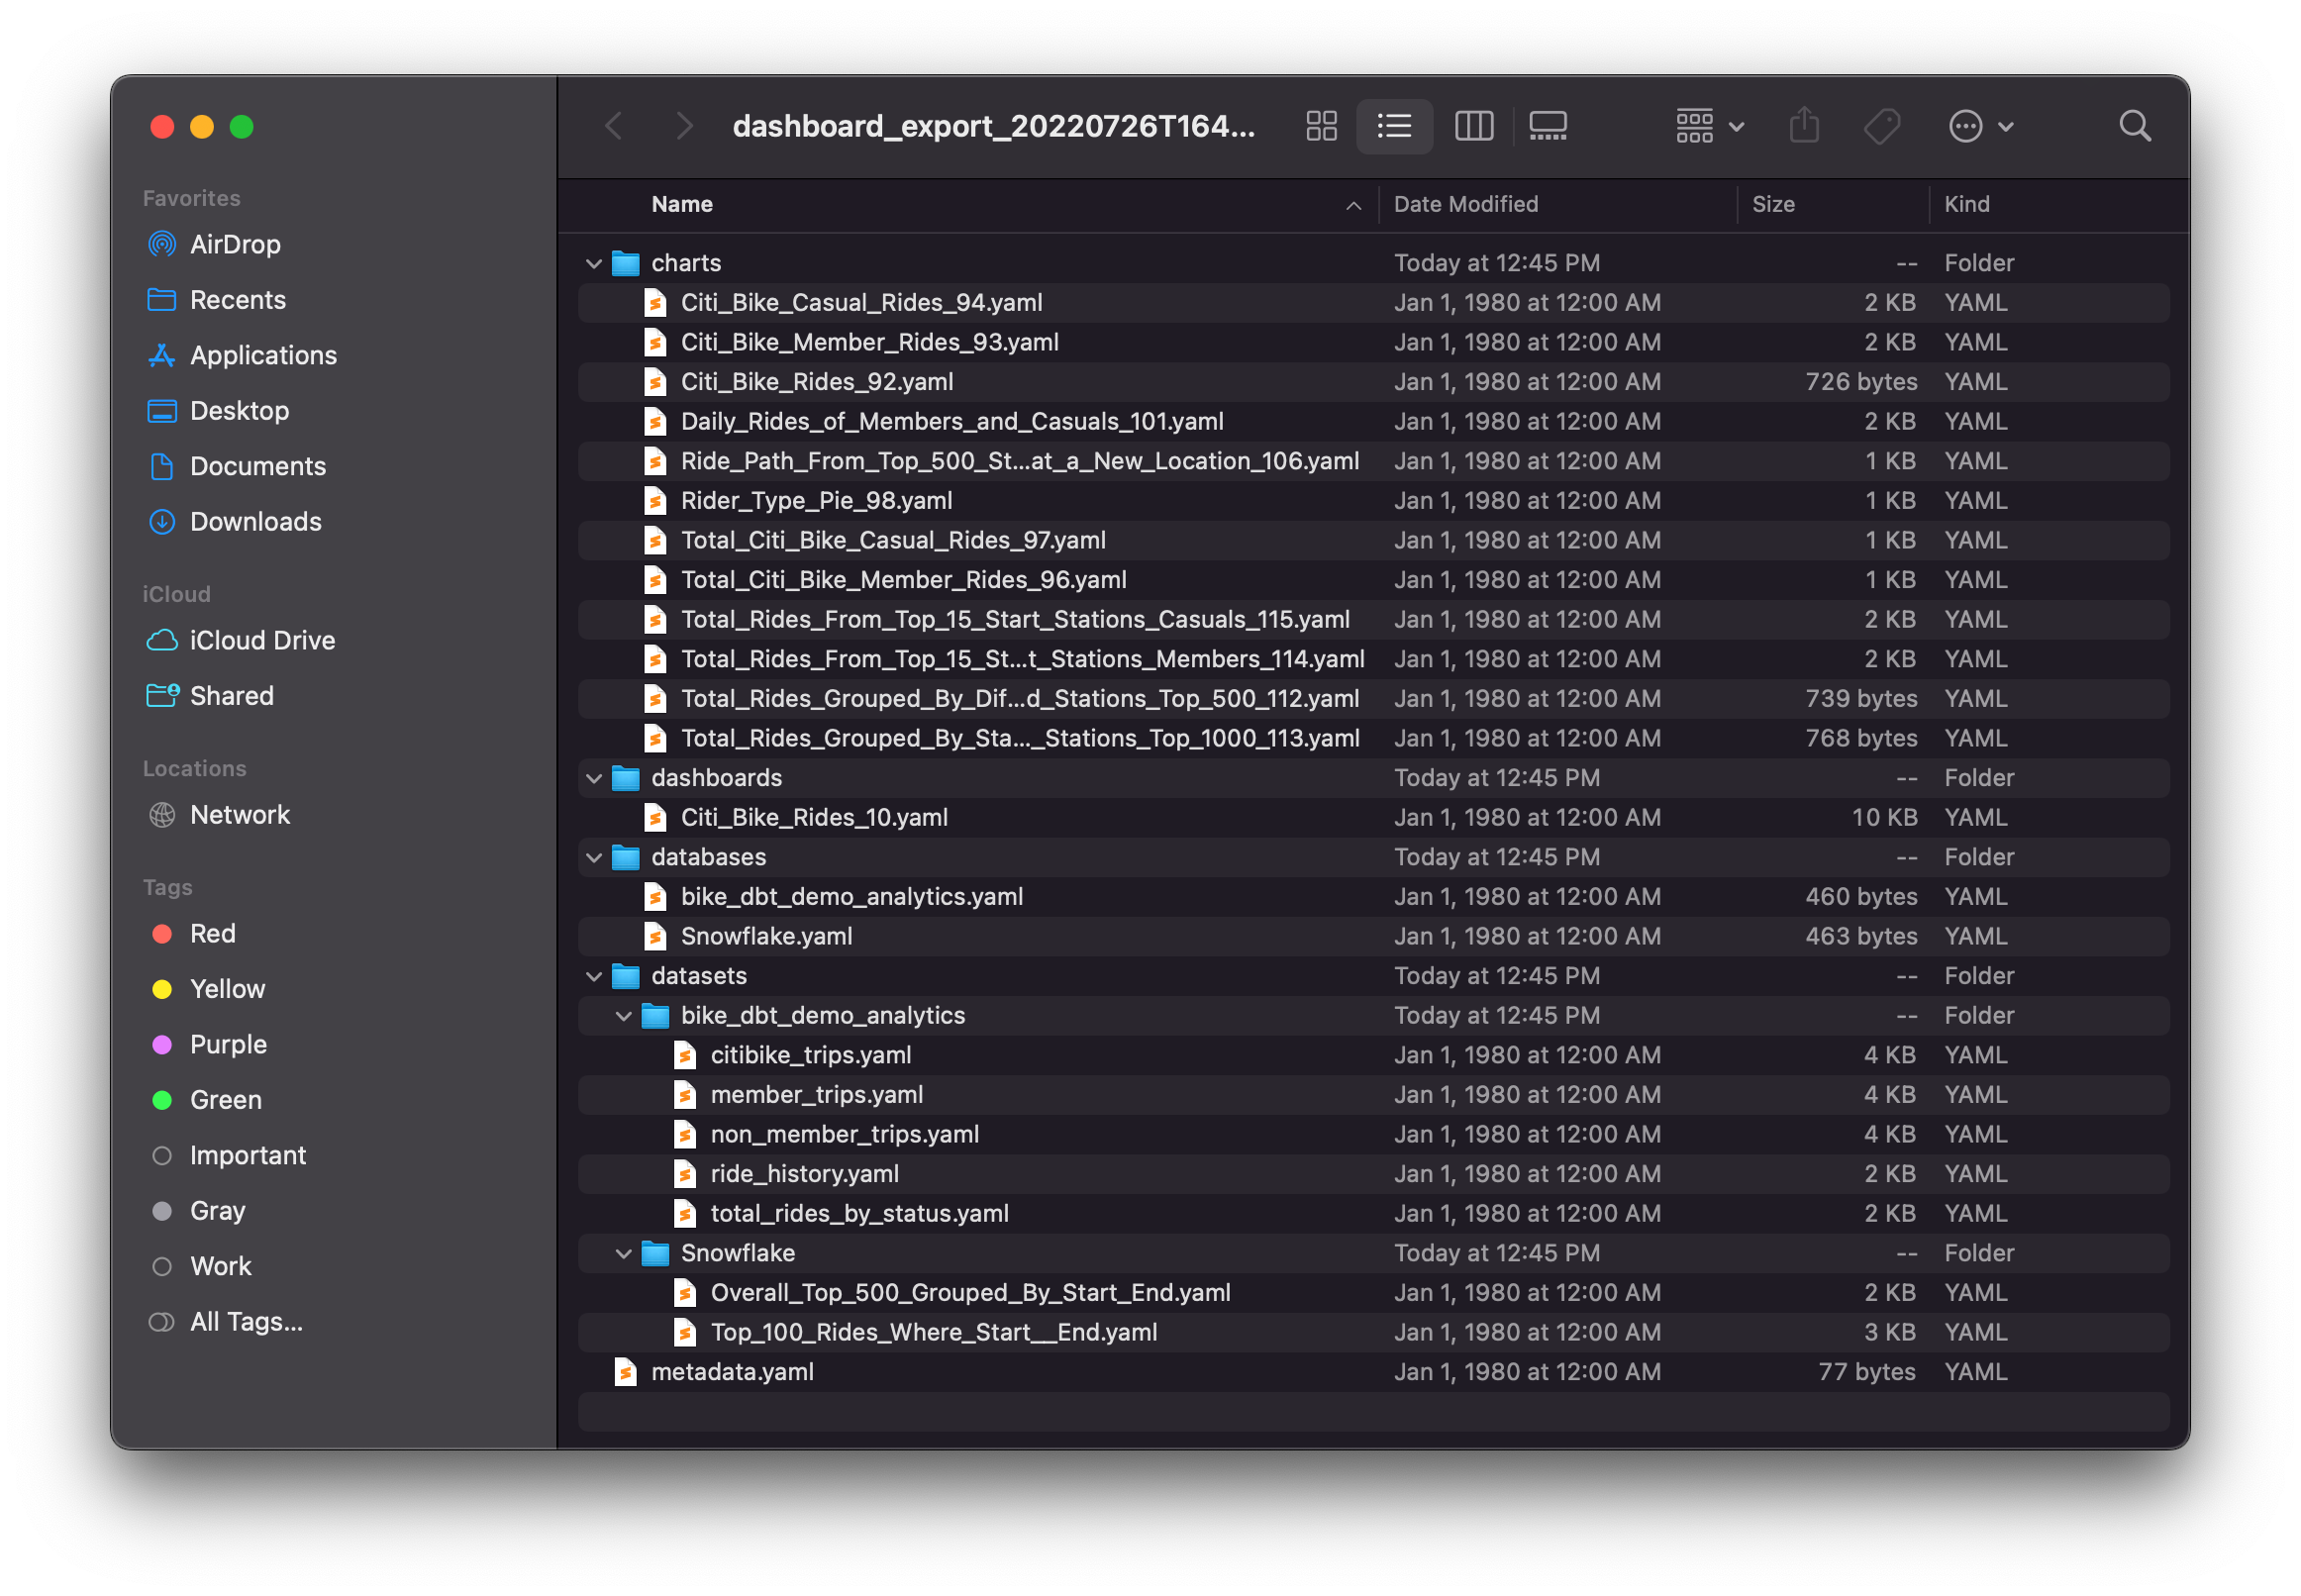
All of these are readable YAML files and we can now add this to source control! In the demo repo, we created an assets directory and added our dashboard, charts, and dataset YAML files:
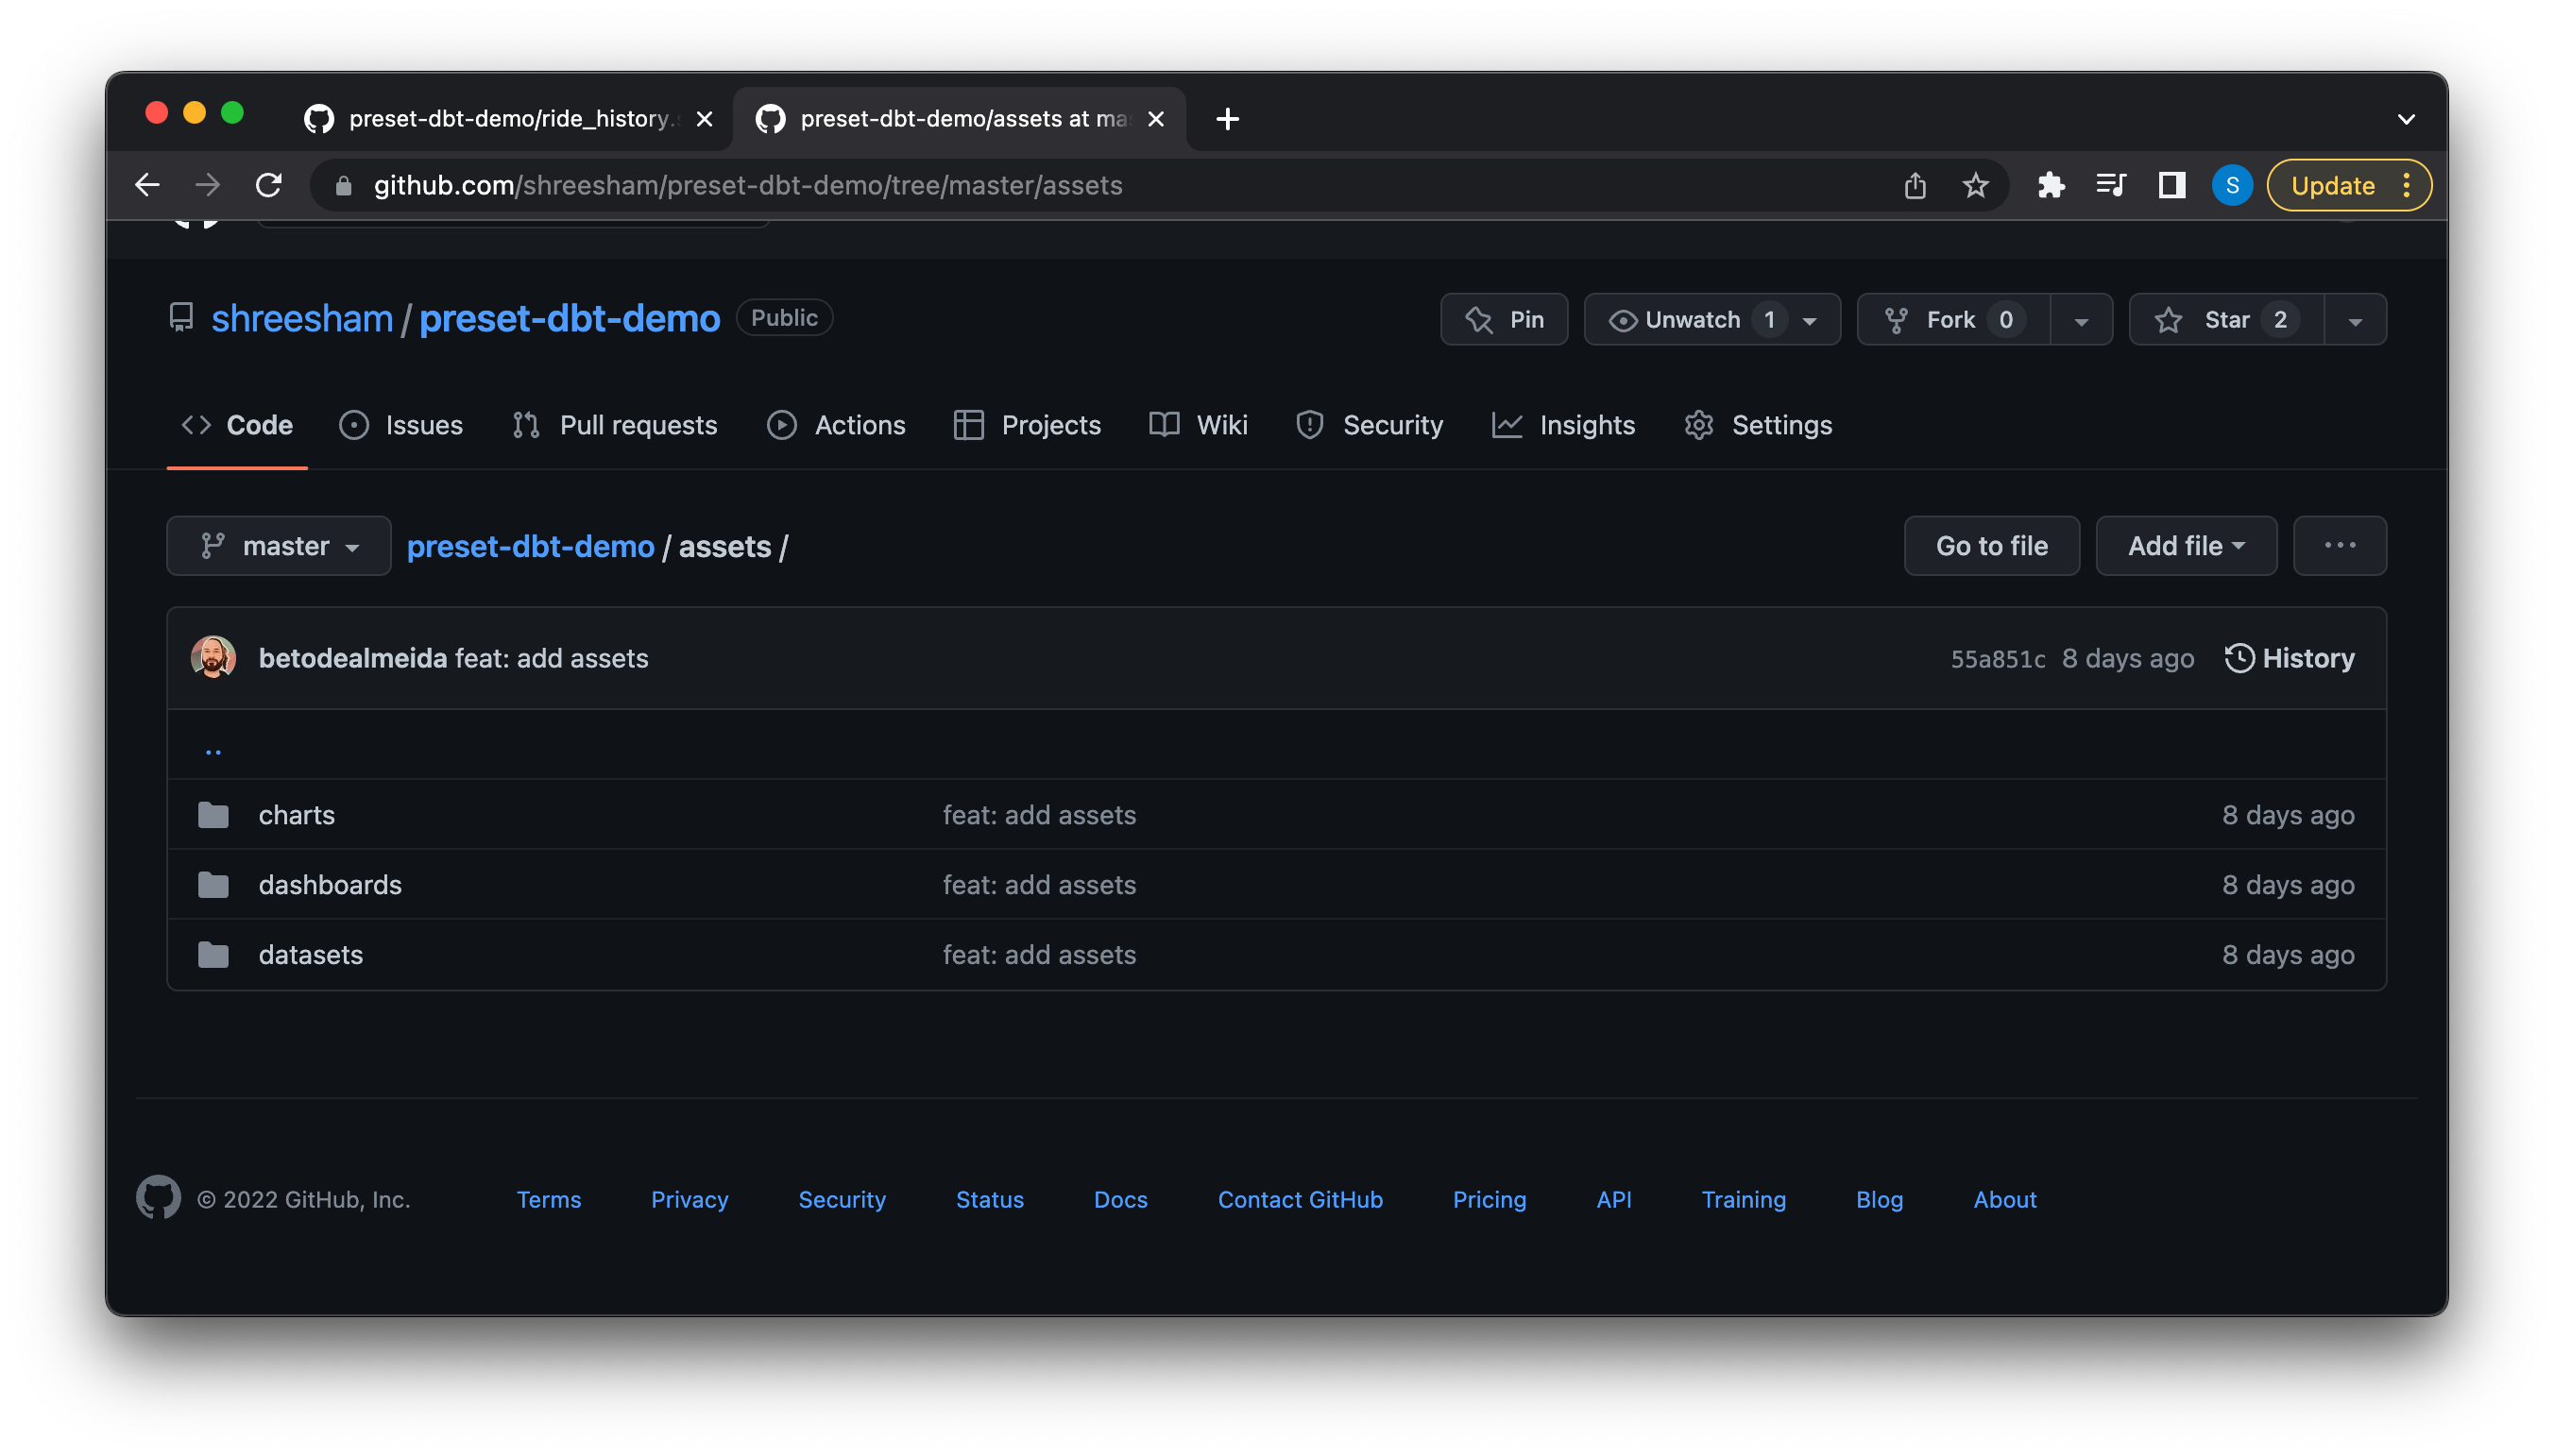
These files can be committed to a separate Git repo from your dbt project as well, but for this example we contained everything in a single location to manage it all together.
The main dashboard YAML file looks something like:
dashboard_title: Citi Bike Rides
description: null
css: ''
slug: null
uuid: d871b4ff-baf8-4d0b-80c8-48b6c23c93b4
position:
  CHART-2vz-O3rF9y:
    children: []
    id: CHART-2vz-O3rF9y
    meta:
      chartId: 101
      height: 70
      sliceName: Daily Rides of Members and Casuals
      uuid: bc2fb9b6-ff5a-423d-8619-0b46135219fe
      width: 8
    parents:
    - ROOT_ID
    - TABS-1OiXrsVsuz
    - TAB-3UtNWN9TkT
    - ROW-v5vR5LtubY
    type: CHART
  CHART-3qqZ-XIlzN:
    children: []
    id: CHART-3qqZ-XIlzN
    meta:
      chartId: 92
      height: 60
      sliceName: Citi Bike Rides
      uuid: ad472d33-bb5b-4bb4-bfbc-f895e2a4d319
      width: 6
    parents:
    - ROOT_ID
    - TABS-1OiXrsVsuz
    - TAB-3UtNWN9TkT
...
This shows the dashboard name and all of the metadata that describes the charts and their positions — which is essentially the bulk of the dashboard.
A chart YAML file looks something like:
slice_name: Citi Bike Casual Rides
viz_type: big_number
params:
  adhoc_filters:
  - clause: WHERE
    comparator: casual
    expressionType: SIMPLE
    filterOptionName: filter_j8fuf8jgez9_ywtbmsjz4zo
    isExtra: false
    isNew: false
    operator: ==
    operatorId: EQUALS
    sqlExpression: null
    subject: member_casual
  color_picker:
    a: 1
    b: 135
    g: 122
    r: 0
  compare_lag: 30
...
It will show the chart name, it’s visualization type, and various other aspects specific to that chart (e.g. metrics defined on them).
Once we have all these files we can modify them directly and push our changes to our repo and merge pull requests in a proper source controlled fashion. For example, if you simply wanted to change the title of your dashboard or chart, you can modify the name in the YAML file, push and merge all your changes, then run the superset sync native command with the Preset CLI.
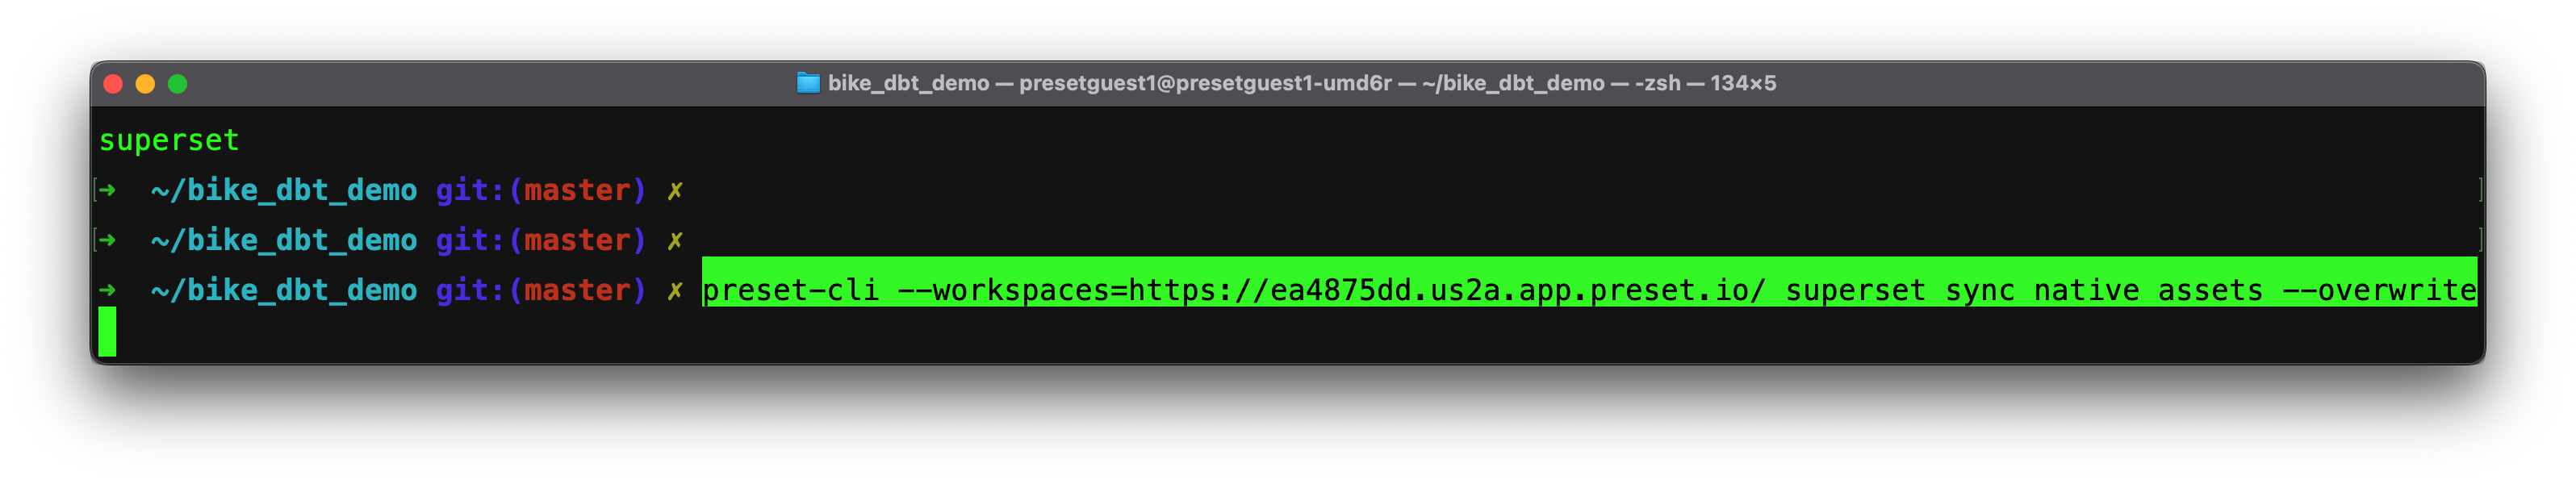
The sync native command has this name because instead of reading dbt files, it will read the YAML files that are the native export from Superset. In the command above we’ve re-specified the workspace, the directory where the Preset assets are (~/assets), and we pass the --overwrite flag to specify that we do want to change/overwrite the assets if they’re there.
Once run, the changes will be reflected in the dashboard. You can see this demonstrated live in our past event
Conclusion
Using Preset’s CLI, databases, datasets, charts, and dashboards can be stored as readable YAML files. These assets can be deployed continuously, to multiple workspaces, with the ability to customize to each one. Combined with a robust data infrastructure with managed and source controlled datasets and models as code with dbt, managing your various dashboards and their dependent assets as code allows for the benefits from version control systems, code review, continuous deployments, and more!
